Rio Tinto Stock Technicals: Gains 1.48% on Friday, Momentum Gains
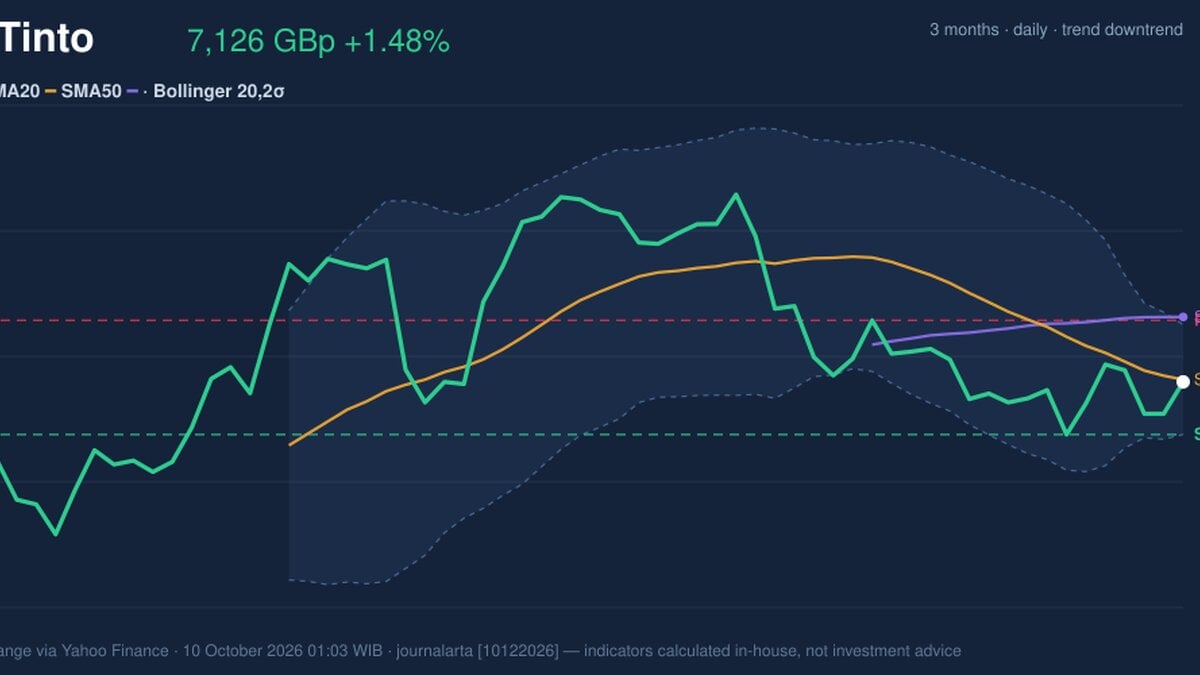
On October 9, 2026: price 7,126.00 GBp, trend downtrend, RSI 46.8, support 6,954.00, resistance 7,327.00. technical analysis of rio tinto stock.
Why Rio Tinto is in focus today
- MACD histogram has just turned positive
- Not covered by JournalArta in the last 14 days
Selected automatically from 16 LSE (UK) stocks by a technical-signal score with daily weighted randomisation — not a recommendation.
Trend & Price Action
At 7,126.00 GBp, Rio Tinto is just below its 20-day simple moving average (SMA) of 7,133.70 GBp and well below its 50-day average of 7,337.98 GBp. A simple moving average smooths daily price changes to show the direction of a trend. The 20-day average’s slope is down 1.52% over five days, reinforcing the bearish backdrop; there has been no recent crossover between the averages to signal a change in trend. The price is also near the middle of its Bollinger range, whose centre is the 20-day average. Its 48% position within the band indicates neither a pronounced push toward the upper boundary nor pressure near the lower one. The bands have narrowed to 5.0%, a squeeze that reflects subdued price movement and can precede a larger move, though it does not indicate which direction that move will take. The share price is testing its short-term average, but remains below both the trend line and the 50-day average.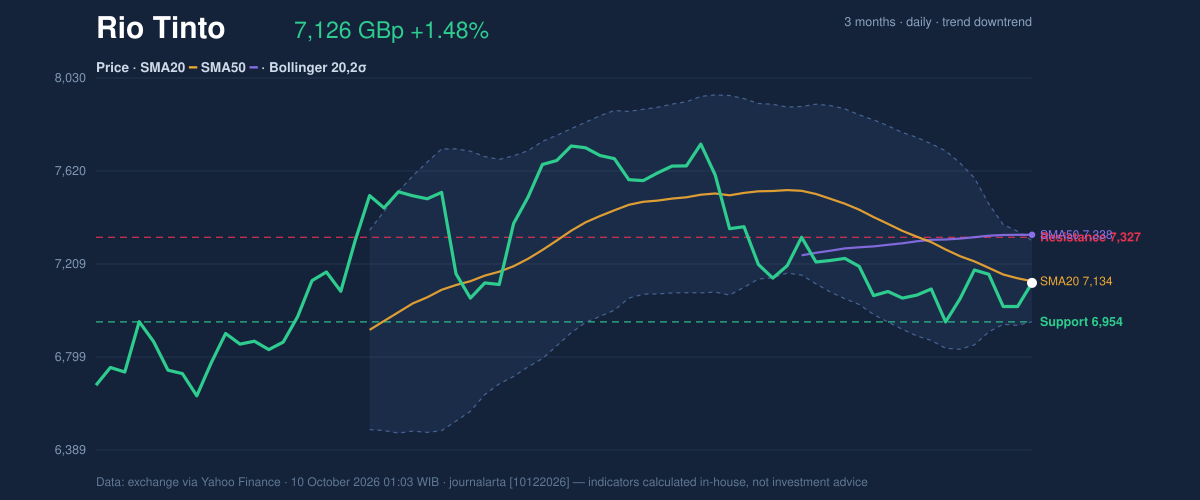
Oscillators & Momentum
The momentum indicators are mixed, but no longer uniformly weak. The 14-day Relative Strength Index (RSI), which gauges the pace of recent gains and losses, is neutral at 46.8. The Stochastic oscillator, which compares a closing price with its recent trading range, is also neutral, with %K at 61.7 and %D at 40.8. Neither reading indicates an extreme condition. MACD remains below zero at -75.007, with its signal line at -75.382. However, the histogram—the difference between those two lines—has turned positive at 0.375. That small positive reading means short-term momentum has improved, not that the wider downtrend has ended. The signal is more persuasive if price can sustain itself above its 20-day average.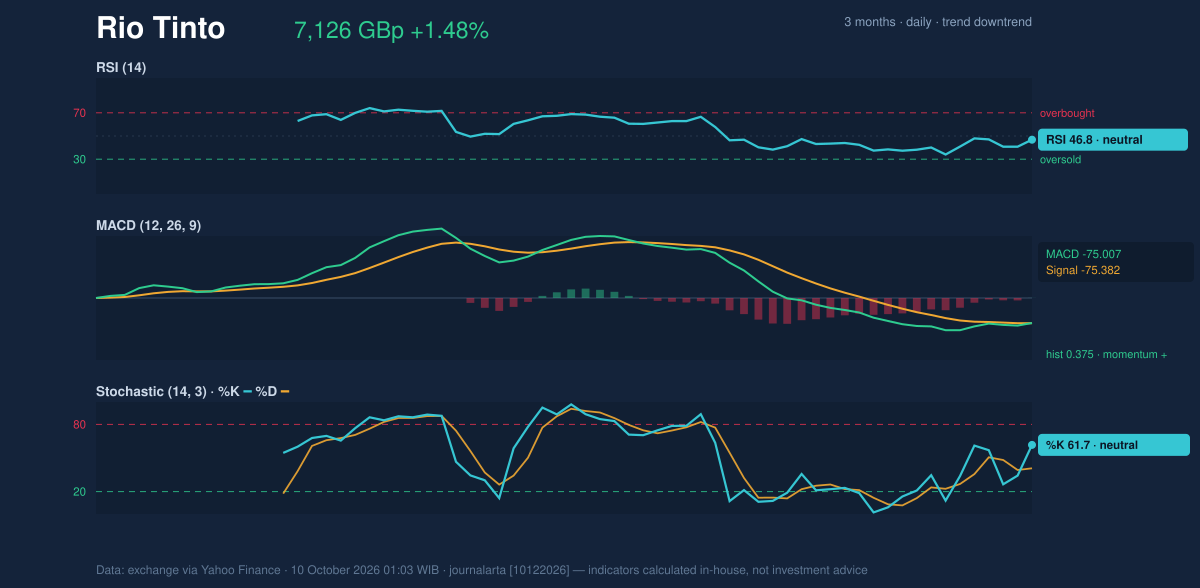
Volatility, Volume & Key Levels
Average True Range (ATR), a measure of typical daily price movement, is 159.84 GBp, or 2.2% of the share price, pointing to moderate volatility. Trading volume was 2,053,559 shares, about 0.9 times the 20-day average of 2,288,107. The session’s rise therefore came on below-average activity, tempering the strength of the move. On-balance volume (OBV), which tracks whether volume flows accompany price rises or falls, is rising—an encouraging sign, though not enough by itself to confirm a breakout. A sustained move above 7,133.70 GBp, the 20-day average, would strengthen the case that momentum is recovering; the next nearby test is 7,327.00 GBp resistance. Failure to hold above the average, or a decline through 6,954.00 GBp support, would weaken that case. With the Bollinger bands squeezed, either boundary could become more significant if trading expands.Technical Verdict: HOLD
HOLD (wait & see) fits the conflicting evidence: the MACD histogram has turned positive and OBV is rising, but price remains below both moving averages, the 20-day slope is still negative, and volume is below its recent norm. The balance is one of tentative momentum improvement inside an unconfirmed downtrend.- Ideal entry range: 6,954.00–7,133.70 GBp, bounded by 20-day support and the 20-day average.
- Exit target: 7,327.00 GBp, the stated 20-day resistance level.
- Stop-loss protection: below 6,954.00 GBp, the stated 20-day support.
Summary Data Rio Tinto
| Last price | 7,126.00 GBp |
| Change 1 day / 5 days / 1 month | 1.48% / 0.99% / -3.36% |
| Trend / MA-cross | downtrend / none |
| SMA20 / SMA50 | 7,133.70 / 7,337.98 |
| RSI (14) / Stochastic %K | 46.8 / 61.7 |
| Bollinger %B / ATR | 48% / 159.84 |
| Support / Resistance 20 days | 6,954.00 / 7,327.00 |
| Data as of | 10 October 2026 01:03 WIB |
Disclaimer: This technical analysis is generated automatically from exchange data (via Yahoo Finance) and indicators calculated by JournalArta, for information and education only. The verdict and the entry, target and stop-loss levels are not investment advice or a solicitation to buy or sell any security. Investment decisions and their risks rest solely with the reader.
Track Rio Tinto share price daily: live levels, support/resistance and our full Rio Tinto analysis history.