OCBC Stock Technicals: Drops 0.28% on Monday, Death Cross Pressure
On October 19, 2026: price 28.92 SGD, trend downtrend, RSI 31.2, support 28.92, resistance 32.22. technical analysis of ocbc stock. OCBC Stock Technicals —…
Why OCBC is in focus today
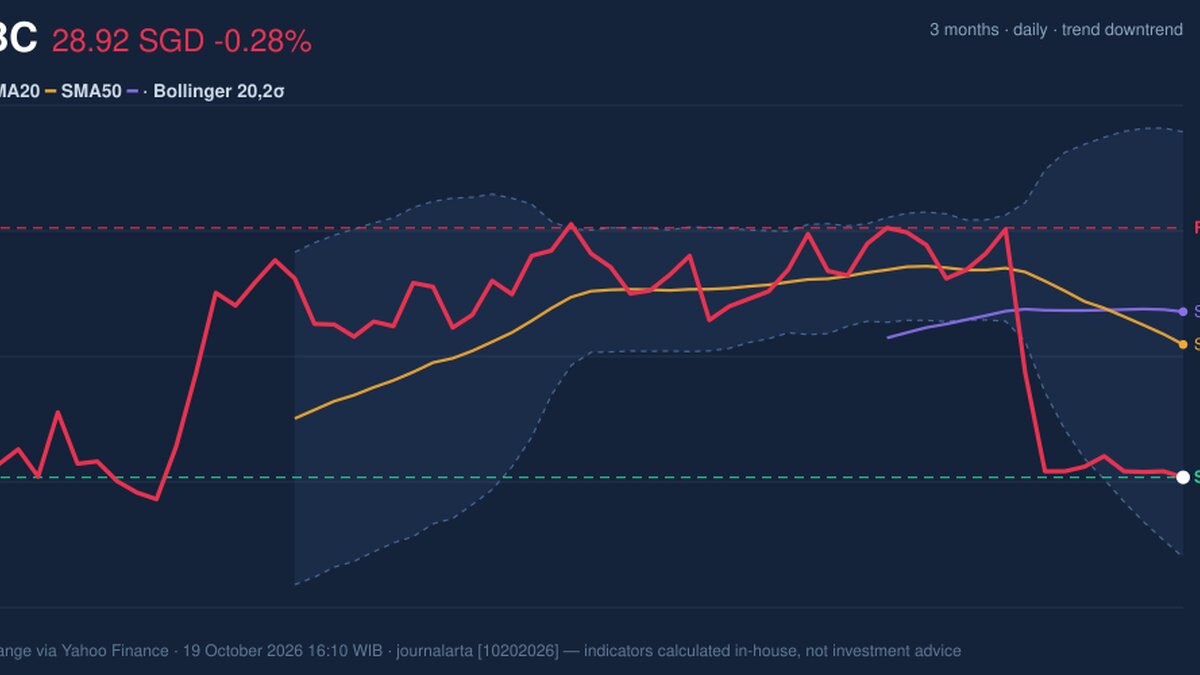
- Closed at a 20-day low (28.92)
- Fresh death cross: SMA20 crossed below SMA50
Selected automatically from 16 SGX (Singapore) stocks by a technical-signal score with daily weighted randomisation — not a recommendation.
Trend & Price Action
Momentum & Volatility
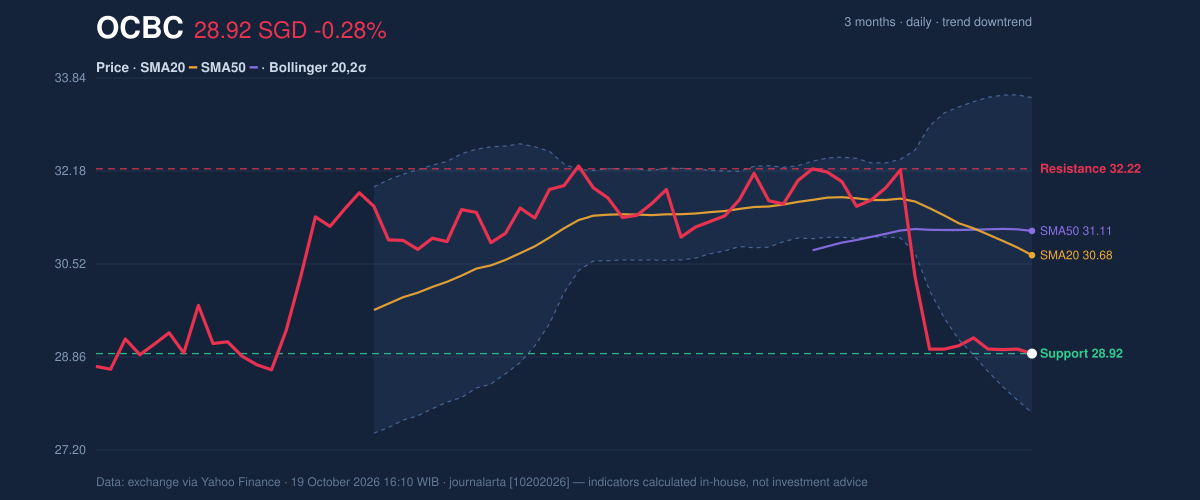
Momentum indicators are weak, but not all point to the same near-term implication. The RSI is 31.2, a reading that the data classifies as neutral, though it is close to the level commonly associated with oversold conditions. Stochastic %K at 10.9 and %D at 9.7 are oversold, showing that prices have been persistently near the lower end of their recent range. Such readings can precede a rebound, but they are not evidence that one has begun. MACD is negative at -0.675, below its -0.426 signal line, with a -0.249 histogram. That alignment indicates downside momentum remains in control rather than confirming a reversal. The contrast matters: the Stochastic reading points to stretched selling, while MACD says the prevailing pressure has not yet eased. [ GRAFIK-MOMENTUM ] The share trades near the lower Bollinger Band at S$27.86, with %B at 19%. Bollinger Bands map a price’s position within a range derived from recent volatility; a low %B means the price is closer to the lower band than the upper one. The low band position reinforces the weakness, but the normal 18.4% band width does not signal an unusually sharp volatility expansion. ATR is S$0.65, or 2.3% of the share price, indicating moderate daily price movement rather than an exceptional volatility regime.Volume & Key Scenarios
Trading volume was 4,867,940 shares, about 0.6 times the 20-day average of 8,631,671. The thin activity means the latest decline was not accompanied by unusually heavy turnover. However, OBV—the running balance of volume on up and down sessions—was also falling, so the quieter volume does not yet provide evidence that buyers are accumulating shares. A hold above S$28.92 would preserve the 20-day support level, though a rebound would still need to contend with the SMA20 and SMA50. A break below that support would invalidate a short-term stabilization scenario and bring the three-month low of S$28.25 into focus. On the upside, S$32.22 is the stated 20-day resistance; the chart would need to recover that area, not merely produce an oversold bounce, to challenge the prevailing downtrend.Technical Verdict: HOLD (wait & see)
The indicators support a cautious, conditional stance rather than a directional call. The death cross and falling SMA20 confirm a weakening trend; negative MACD shows downside momentum is still active; and oversold Stochastic readings leave room for a rebound but do not confirm one. The verdict is invalidated if the price falls below S$28.92, the stated 20-day support. - Ideal entry range: S$28.92–S$30.68, bounded by 20-day support and the SMA20. - Exit target (target price): S$32.22, the 20-day resistance. - Stop-loss protection: Below S$27.86, the lower Bollinger Band. For non-traders, the chart says OCBC is weak but stretched, so a clearer signal would require the share to hold support or recover ground.Summary Data OCBC
| Last price | 28.92 SGD |
| Change 1 day / 5 days / 1 month | -0.28% / -0.48% / -8.68% |
| Trend / MA-cross | downtrend / death |
| SMA20 / SMA50 | 30.68 / 31.11 |
| RSI (14) / Stochastic %K | 31.2 / 10.9 |
| Bollinger %B / ATR | 19% / 0.65 |
| Support / Resistance 20 days | 28.92 / 32.22 |
| Data as of | 19 October 2026 16:10 WIB |
Disclaimer: This technical analysis is generated automatically from exchange data (via Yahoo Finance) and indicators calculated by JournalArta, for information and education only. The verdict and the entry, target and stop-loss levels are not investment advice or a solicitation to buy or sell any security. Investment decisions and their risks rest solely with the reader.
Track OCBC share price daily: live levels, support/resistance and our full OCBC analysis history.