Testing Key Resistance, UNH Stock Gains 1.36% on Monday
On October 19, 2026: price 406.88 USD, trend sideways, RSI 65.7, support 365.20, resistance 406.88. technical analysis of unh stock. Testing Key Resistance —…
By Alistair Sterling
October 20, 20264 min read
Testing Key Resistance, UNH Stock Gains 1.36% on Monday
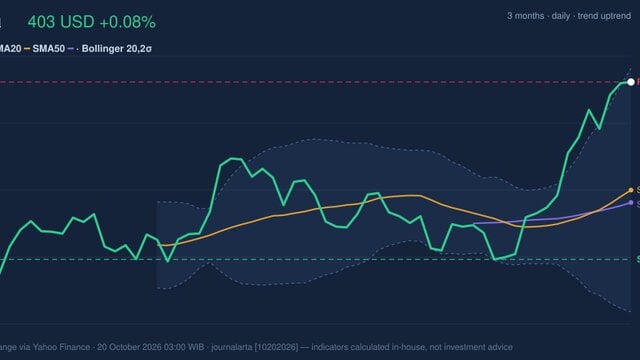
UnitedHealth Group rose 1.36% on the New York Stock Exchange to $406.88, putting the health insurer at the top of its 20-trading-day range as its recent advance meets signs of short-term strain. The move extends gains to 7.49% over five trading days and 7.77% over one month. But trading volume was below its 20-day average, and the price has moved above the upper Bollinger Band—a measure of how far a price has stretched relative to its recent range.
Trend & Price Action
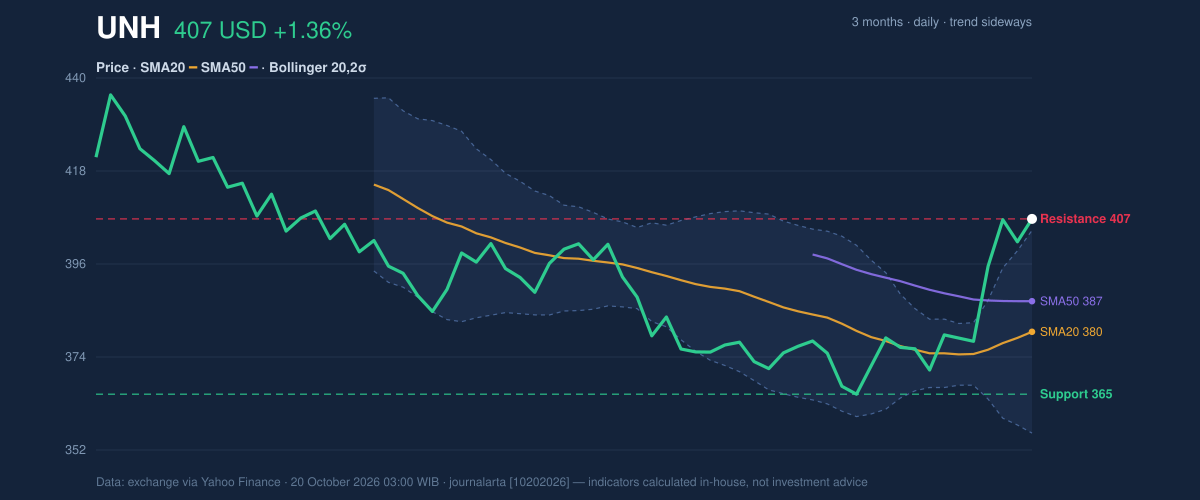
The technical picture is improving, though it does not yet show a confirmed change in the broader trend. UNH is above its 20-day simple moving average (SMA) of $380.04, while that average has risen 1.43% over five trading days. The share price is also above the 50-day SMA at $387.29. There has been no new moving-average crossover, so the recent strength is not yet backed by that particular trend signal.
The shares are at 100% of the 20-day range, with resistance at $406.88 and support at $365.20. That places the price at a point where further gains would need to establish a fresh high for the period, rather than simply recover ground within the range. The three-month high of $437.00 remains a broader reference point; the three-month low is $362.60.
As shown in the chart, the price has pushed above the upper Bollinger Band at $404.13, while the band’s midpoint is $380.04 and its lower boundary is $355.95. A reading above the upper band can signal that a move has become stretched, not that a reversal is certain. The band width of 12.7% is described as normal, offering no squeeze signal that would point to an unusually tight market before a sharp move.
3-month price action chart of UNH: price, SMA20/50, Bollinger, support & resistance. Data: exchange via Yahoo Finance.
Oscillators & Momentum
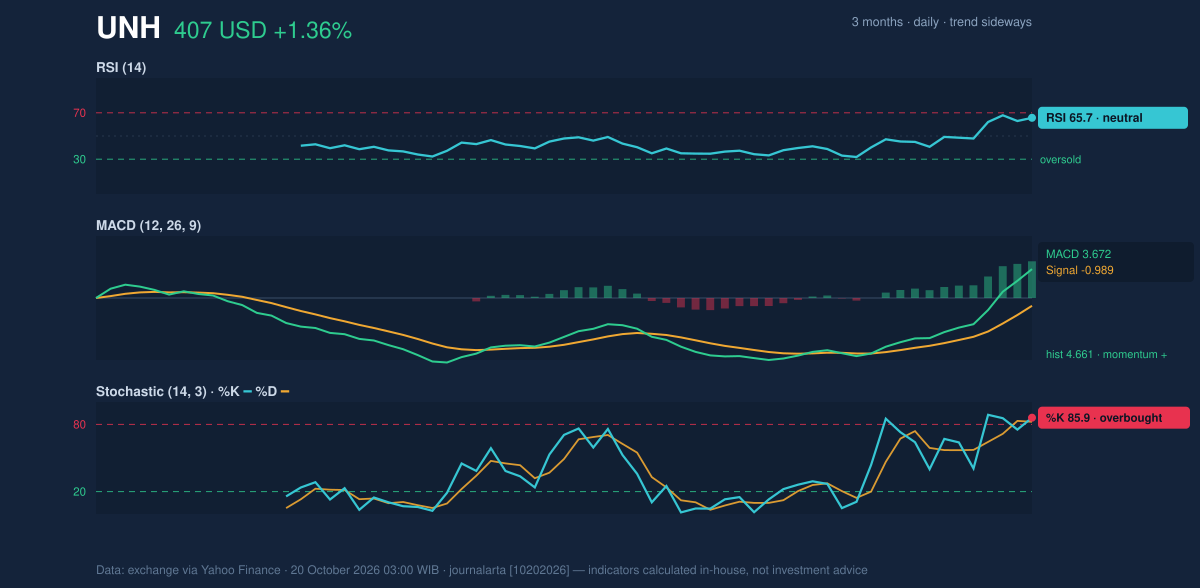
Momentum indicators are positive but not uniform. The RSI is 65.7, in neutral territory, suggesting strength without reaching the data’s overbought classification. By contrast, the Stochastic is overbought, with %K at 85.9 and %D at 82.3. That divergence matters: the advance has momentum, but the faster-moving oscillator says the shares may be vulnerable to a pause or pullback.
The MACD is positive at 3.672, with a signal value of -0.989 and a histogram of 4.661. The positive MACD and histogram support the recent upward momentum. They do not erase the caution from the Stochastic reading, especially with the share price at the range ceiling.
Momentum chart of UNH: RSI(14), MACD, Stochastic. Data: exchange via Yahoo Finance.
Volatility & Participation
The average true range (ATR), a measure of typical daily price movement, is $12.87, or 3.2% of the share price, indicating moderate volatility. That makes the distance between current trading and nearby technical levels meaningful: routine price swings can be substantial, so a single touch of resistance or support is not, on its own, confirmation of a breakout or breakdown.
Participation offers less confirmation than price momentum. The latest volume of 4,996,900 shares was about 0.8 times the 20-day average of 5,896,275, while on-balance volume (OBV)—a running measure that tracks whether volume tends to accompany rising or falling prices—was declining. The combination suggests the advance has not yet drawn stronger-than-usual trading participation. If the price clears the range ceiling while volume and OBV improve, that would provide stronger confirmation; failure to hold the moving averages would put the recent gain under pressure.
Technical Verdict: HOLD
The technical verdict is HOLD (wait & see): the rising 20-day average, price above both moving averages and positive MACD support the advance, but the overbought Stochastic, declining OBV and price above the upper Bollinger Band argue against treating the move as confirmed. This verdict is invalidated if UNH falls below the $365.20 20-day support.
Ideal entry range: $380.04–$387.29, around the 20-day and 50-day SMAs.
Exit target: $406.88, the 20-day resistance level in the supplied data.
Stop-loss protection: $365.20, the 20-day support level.
In plain English, the chart shows a strong recent rise but not enough confirmation to establish that it can hold at the top of its range.
Data: exchange data via Yahoo Finance, as of October 20, 2026, 03:00 WIB.
Summary Data UNH
Last price
406.88 USD
Change 1 day / 5 days / 1 month
1.36% / 7.49% / 7.77%
Trend / MA-cross
sideways / none
SMA20 / SMA50
380.04 / 387.29
RSI (14) / Stochastic %K
65.7 / 85.9
Bollinger %B / ATR
106% / 12.87
Support / Resistance 20 days
365.20 / 406.88
Data as of
20 October 2026 03:00 WIB
Disclaimer: This technical analysis is generated automatically from exchange data (via Yahoo Finance) and indicators calculated by JournalArta, for information and education only. The verdict and the entry, target and stop-loss levels are not investment advice or a solicitation to buy or sell any security. Investment decisions and their risks rest solely with the reader.