RELX RSI Overbought: Stock Gains 1.54% (October 21, 2026)
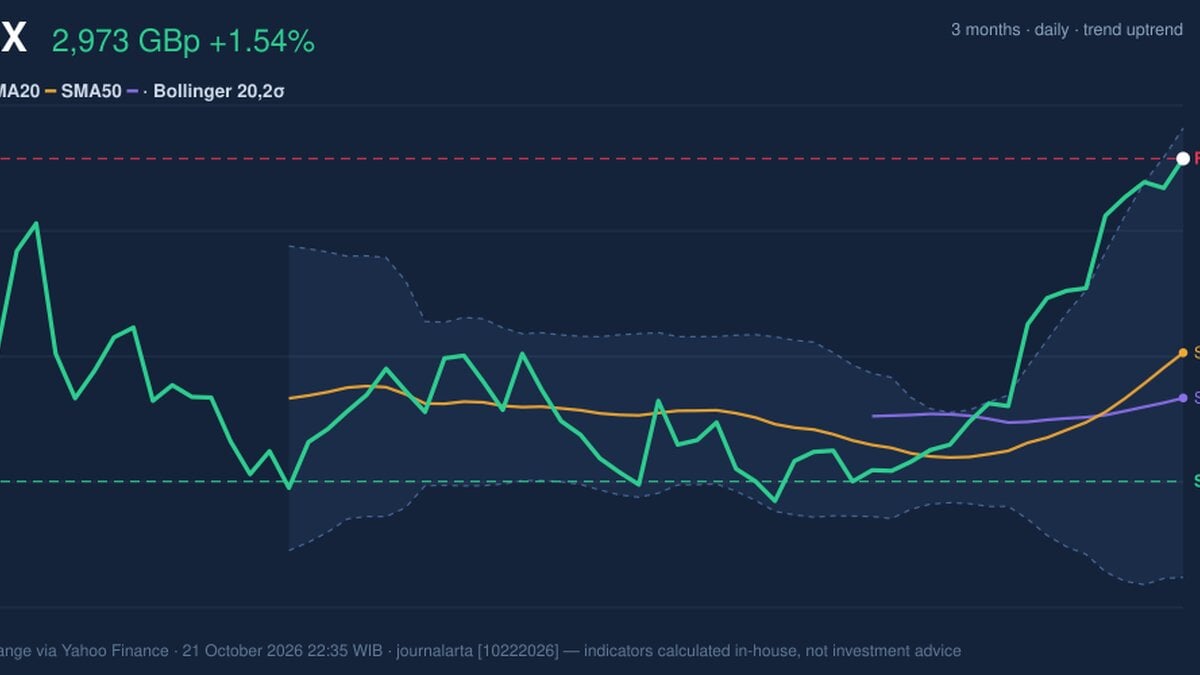
On October 21, 2026: price 2,973.00 GBp, trend uptrend, RSI 79.7, support 2,480.00, resistance 2,973.00. technical analysis of relx stock.
Why RELX is in focus today
- Closed at a 20-day high (2,973.00)
- Trading near its 3-month high (2,973.00)
- Fresh golden cross: SMA20 crossed above SMA50
- RSI(14) at 79.7 — overbought zone
- Uptrend confirmed (5-day change 7.14%)
Selected automatically from 16 LSE (UK) stocks by a technical-signal score with daily weighted randomisation — not a recommendation.
Trend & Price Action
RELX is trading above both its SMA20 at 2,676.40 and SMA50 at 2,607.32. The SMA20 has crossed above the SMA50, a pattern known as a golden cross that can indicate improving trend strength. Its rising slope—4.14% over five days—also suggests the shorter-term trend is accelerating rather than merely holding steady. That strength has brought the share price to a decision point. At 2,973.00, RELX sits at the stated 20-day resistance and the top of its observed range. A close above that level would mark a fresh break from the supplied range; failure to sustain the advance could leave the shares vulnerable to a pullback toward support. The data gives a 20-day support level of 2,480.00, well below the current price.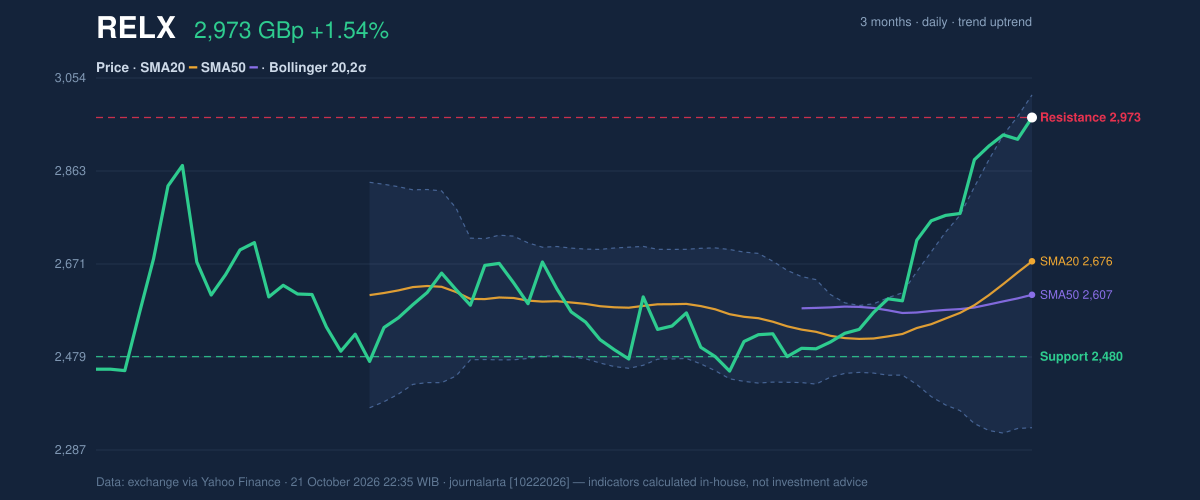
Oscillators & Momentum
Momentum confirms the direction of the move, but raises a caution about its pace. RSI is 79.7, above the commonly watched overbought threshold of 70. Stochastic is similarly extended, with %K at 100.0 and %D at 96.9. These readings describe a market where recent gains have been unusually strong; they do not, by themselves, establish that a reversal has begun. The MACD offers the clearest confirmation of positive momentum: MACD is 104.739, above its 66.794 signal line, with a positive histogram of 37.946. That alignment supports the uptrend, even as the high RSI and Stochastic readings leave less room for a short-term surge without consolidation. In plain terms, the trend is positive, but the shares may need to pause before that strength can be judged durable.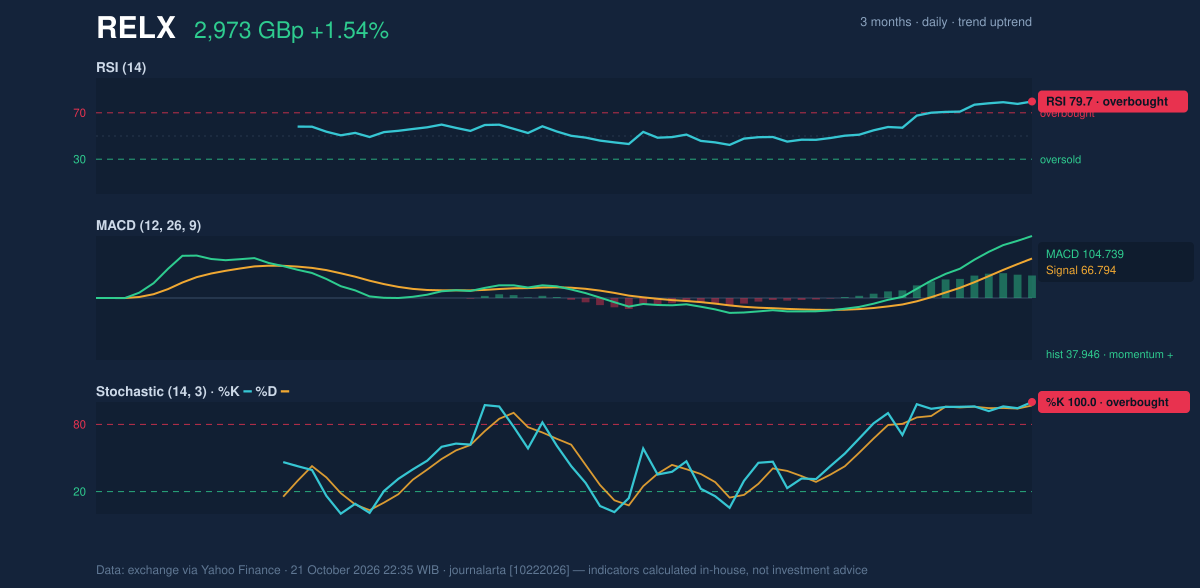
Volatility & Volume
The price is near the upper Bollinger Band at 3,019.57, with %B at 93%. %B shows where the price sits within the band: a reading near the top means RELX is pressing against the upper boundary. The bands have widened to 25.6%, signalling rising volatility rather than a quiet, tightly contained advance. That matters because the ATR is 279.93, or 9.4% of the share price. ATR estimates the typical range of price movement; at this level, swings can be large relative to the current price. A touch of the upper band is not a sell signal, but combined with overbought oscillators it raises the risk that the next move includes sharp reversals. Participation is a significant qualification. The latest reported volume was 1,000, against a 20-day average of 3,953,085—effectively zero when expressed as a multiple of that average. OBV, a running measure that combines price direction with volume, is rising, but the exceptionally thin latest volume weakens confidence that the closing high reflects broad market participation. The volume figures therefore make confirmation on subsequent sessions especially important.Key Levels & Scenarios
The immediate level is resistance at 2,973.00, which is also the current price and the top of the stated 20-day range. A sustained move beyond it would show that buyers have overcome the existing ceiling; without that confirmation, the combination of stretched momentum and thin volume leaves room for consolidation. The upper Bollinger Band at 3,019.57 is a nearby volatility reference, not a guaranteed barrier. On a pullback, the first technical reference is the Bollinger midline and SMA20 at 2,676.40, followed by the SMA50 at 2,607.32. The more distant stated 20-day support is 2,480.00. A fall below that support would undermine the current bullish technical structure.Technical Verdict: HOLD (wait & see)
The indicators present a strong uptrend, but not a clean entry signal at the current level. The golden cross and positive MACD support the advance; the overbought RSI and Stochastic, price near the upper Bollinger Band, and thin reported volume argue for caution. - Ideal entry range: 2,676.40–2,607.32, using the SMA20 and SMA50 as pullback references. - Exit target (Target Price): 3,019.57, the upper Bollinger Band. - Stop-loss protection: 2,480.00, the stated 20-day support. - Invalidation: The bullish technical case is invalidated if price falls below 2,480.00. For non-traders, the chart points to strong upward momentum, but also to a share price that may be running ahead of confirmation from trading activity.| Data point | Reading |
|---|---|
| Latest price | 2,973.00 GBp |
| SMA20 / SMA50 | 2,676.40 / 2,607.32 |
| RSI(14) | 79.7 |
| Stochastic %K / %D | 100.0 / 96.9 |
| MACD / signal / histogram | 104.739 / 66.794 / 37.946 |
| 20-day support / resistance | 2,480.00 / 2,973.00 |
| ATR(14) | 279.93 |
Summary Data RELX
| Last price | 2,973.00 GBp |
| Change 1 day / 5 days / 1 month | 1.54% / 7.14% / 18.40% |
| Trend / MA-cross | uptrend / golden |
| SMA20 / SMA50 | 2,676.40 / 2,607.32 |
| RSI (14) / Stochastic %K | 79.7 / 100.0 |
| Bollinger %B / ATR | 93% / 279.93 |
| Support / Resistance 20 days | 2,480.00 / 2,973.00 |
| Data as of | 21 October 2026 22:35 WIB |
Disclaimer: This technical analysis is generated automatically from exchange data (via Yahoo Finance) and indicators calculated by JournalArta, for information and education only. The verdict and the entry, target and stop-loss levels are not investment advice or a solicitation to buy or sell any security. Investment decisions and their risks rest solely with the reader.
Track RELX share price daily: live levels, support/resistance and our full RELX analysis history.