TSM Stock Drops 4.52%, Testing Support Level In Focus
On October 22, 2026: price 412.35 USD, trend sideways, RSI 37.9, support 412.35, resistance 485.80. technical analysis of tsm stock. TSM Stock Drops — full…
Why TSM is in focus today
- One-day move of -4.52%, about 1.3× its average daily range (ATR)
- Closed at a 20-day low (412.35)
- Not covered by JournalArta in the last 14 days
Selected automatically from 30 NYSE (US) stocks by a technical-signal score with daily weighted randomisation — not a recommendation.
Trend & Price Action
The shares are below both their 20-day simple moving average, or SMA20, at $447.20 and their 50-day average at $434.36. The SMA20 is also sloping downward, falling 1.40% over five trading days. There has been no new moving-average crossover, so the setup does not mark a fresh technical turning point; instead, price weakness is developing beneath declining short-term trend support. At $412.35, TSM is at the bottom of its 20-day range, with resistance at $485.80. The latest close also sits just above the lower Bollinger Band at $404.05. Bollinger Bands plot a moving average and a range around it; here, the price’s position near the lower band signals sustained pressure, though the band width of 19.3% is described as normal rather than unusually tight or expanded. The three-month range, from $372.72 to $487.47, shows that the stock has room below its current level before reaching its period low, but that history alone does not establish a floor. As shown in the chart, the price is pressed against the lower end of its recent range and remains well below the central trend markers.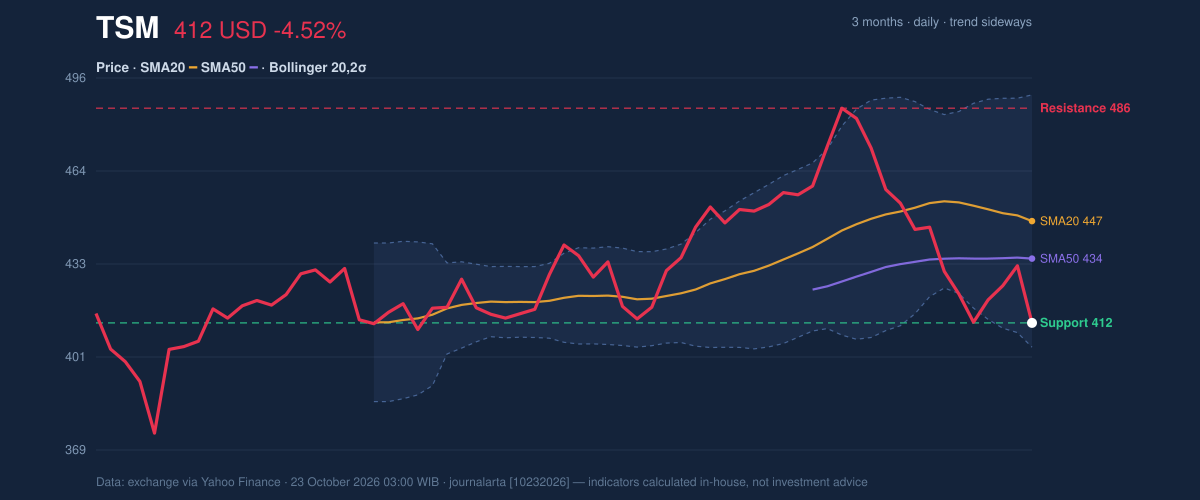
Oscillators & Momentum
Momentum indicators are weak, but they do not all say the same thing. The RSI, a measure of the speed and scale of recent price changes, is 37.9 and classified as neutral. It reflects pressure without yet confirming an extreme reading. The Stochastic oscillator, which compares the latest close with its recent trading range, is more stretched: %K is 6.5 and %D is 19.9, both consistent with an oversold condition. That can occur during a sell-off and is not, by itself, proof of a rebound. The MACD is negative at -5.297, with a signal reading of 0.010 and a histogram of -5.307. Because the MACD and histogram are below zero, the indicator points to negative momentum rather than a confirmed reversal. The contrast is important: oversold Stochastic readings suggest the fall may be extended, while negative MACD momentum says sellers still have the stronger signal.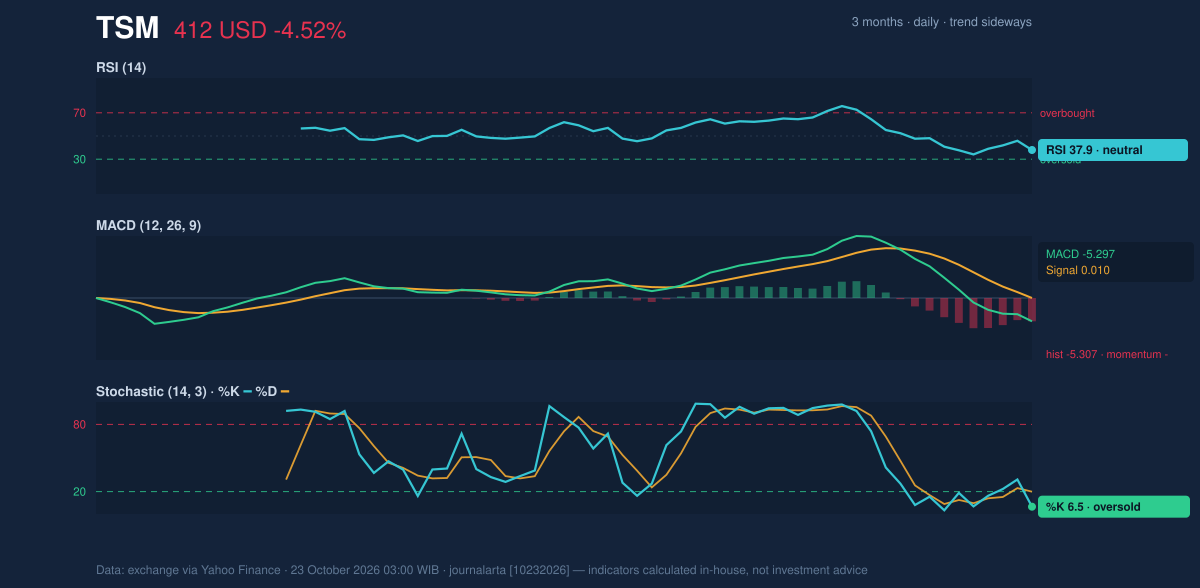
Volatility, Volume & Levels
The average true range, or ATR, is $13.86, equal to 3.4% of the latest price. ATR estimates typical daily movement; the latest decline, at about 1.3 times that measure, was larger than usual but not an unprecedented volatility reading based on the data provided. The Bollinger width is normal, offering no squeeze signal that would indicate an unusually compressed market preparing for a sharp move. Volume reached 16.42 million shares against a 20-day average of 11.28 million. Meanwhile, on-balance volume (OBV), which tracks whether volume tends to accompany rising or falling prices, is declining. Together, higher-than-normal turnover and falling OBV strengthen the interpretation that the drop had broad selling participation, rather than being a low-volume wobble. The immediate reference point is $412.35 support, the stated 20-day support and the latest close. If price holds above it, oversold Stochastic readings could ease, but a sustained recovery would still need to contend with the moving averages at $434.36 and $447.20. If support fails, the three-month low at $372.72 is the next notable historical reference in the supplied data. On the upside, $485.80 resistance marks the upper end of the 20-day range.Technical Verdict: HOLD
The technical balance supports HOLD (wait & see), reflecting a sharp, high-volume decline and negative momentum, offset by an oversold Stochastic reading near support. This is an indicator-based classification, not an investment recommendation. - Ideal Entry Range: $404.05–$412.35, bounded by the lower Bollinger Band and stated 20-day support; this zone is conditional on support holding. - Exit Target (Target Price): $434.36–$447.20, the SMA50-to-SMA20 zone that price would need to reclaim to improve the short-term structure. - Stop Loss: Below $404.05, the lower Bollinger Band, as a defined protection level. - Invalidation: The HOLD verdict is invalidated if price breaks below $372.72, the three-month low. For non-traders, the indicators show a stock under clear selling pressure, but already near a short-term support area where the next move needs confirmation. As of October 23, TSM closed at $412.35.Summary Data TSM
| Last price | 412.35 USD |
| Change 1 day / 5 days / 1 month | -4.52% / -2.34% / -8.60% |
| Trend / MA-cross | sideways / none |
| SMA20 / SMA50 | 447.20 / 434.36 |
| RSI (14) / Stochastic %K | 37.9 / 6.5 |
| Bollinger %B / ATR | 10% / 13.86 |
| Support / Resistance 20 days | 412.35 / 485.80 |
| Data as of | 23 October 2026 03:00 WIB |
Disclaimer: This technical analysis is generated automatically from exchange data (via Yahoo Finance) and indicators calculated by JournalArta, for information and education only. The verdict and the entry, target and stop-loss levels are not investment advice or a solicitation to buy or sell any security. Investment decisions and their risks rest solely with the reader.
Track TSM stock price daily: live levels, support/resistance and our full TSM analysis history.