ARM Death Cross Pressure: Stock Gains 6.19% (October 26, 2026)
On October 26, 2026: price 223.35 USD, trend downtrend, RSI 38.3, support 210.10, resistance 307.49. technical analysis of arm stock. ARM Death Cross Pressure…
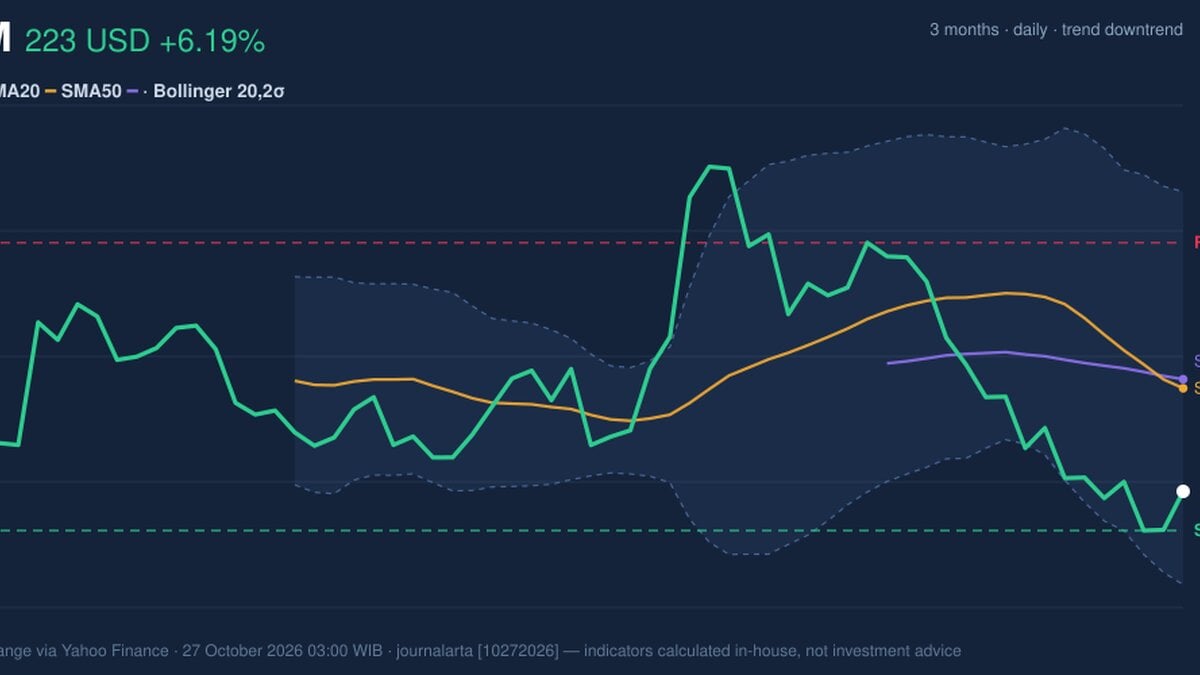
Trend & Price Action
ARM trades below both its 20-day simple moving average of $258.26 and its 50-day average of $261.28. The 20-day average has fallen 8.41% over five days, while its move below the 50-day average has produced a death cross. Together, those signals point to persistent selling pressure: the recent daily gain has not yet reversed the downward structure. The share price is near the lower end of its recent range. It sits about 14% of the way through the $210.10–$307.49 range tracked over 20 trading days, and close to the three-month low of $208.30. That proximity can make the area around the range floor important: holding it could support a stabilization attempt, while a break would leave the stock below its recent trading base. As shown in the chart, the moving averages remain overhead, while the Bollinger bands—which expand to show larger price swings—are wide. The price’s position within those bands is low, but the band width of 51.5% signals unusually high volatility rather than a settled bottom.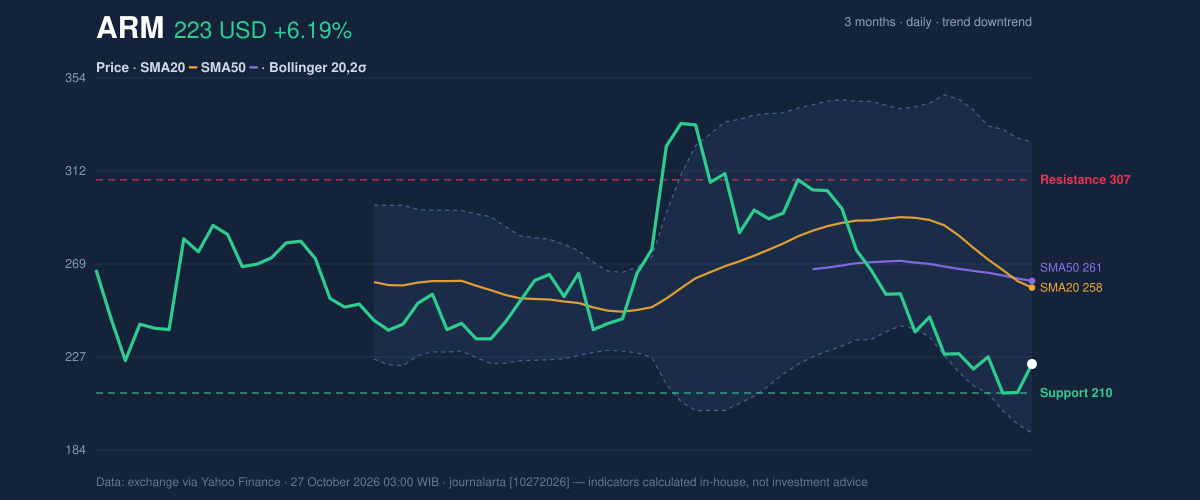
Oscillators & Momentum
Momentum indicators remain mixed. The RSI is 38.3, a neutral reading that is below the midpoint commonly associated with stronger momentum, but not itself a decisive oversold signal. The Stochastic oscillator is more stretched: %K at 16.3 and %D at 6.7 are in oversold territory, suggesting the recent decline may have left the stock vulnerable to a short-term rebound. That possibility is not yet confirmed by MACD, a measure of the relationship between shorter- and longer-term price momentum. Its reading is -16.650, below the signal line at -10.944, with a negative histogram of -5.706. The configuration indicates that downward momentum remains in place despite the session’s advance. A sustained improvement would require the momentum readings to strengthen, not merely a single positive day. The chart helps distinguish the signals: Stochastic points to a stretched decline, while MACD still shows negative momentum and RSI remains subdued.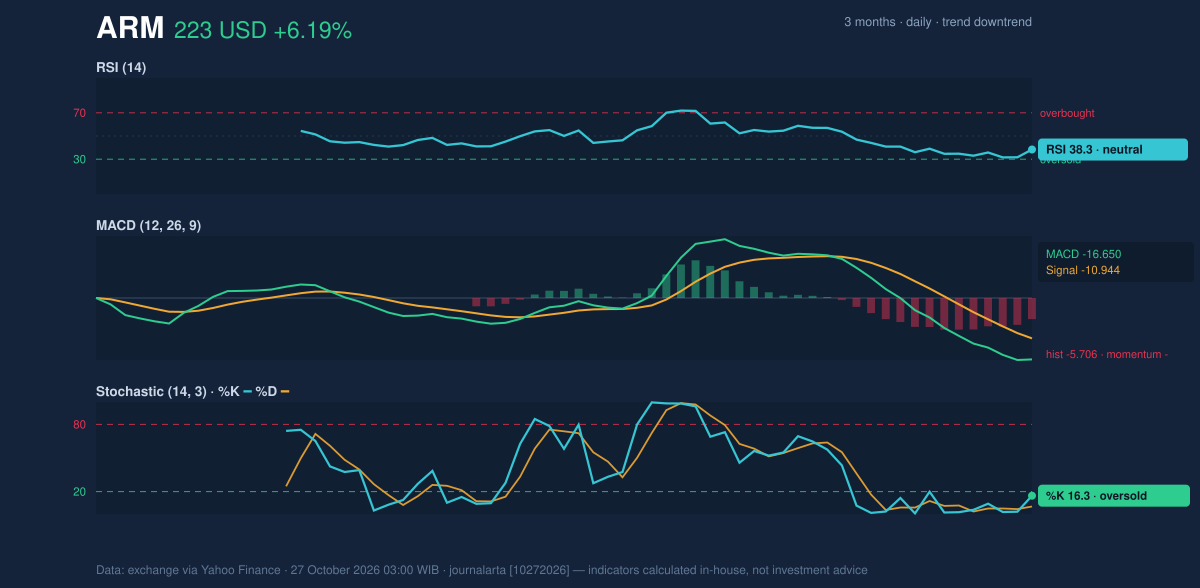
Volatility, Volume & Key Levels
ARM’s latest volume was 4,668,700 shares, almost exactly its 20-trading-day average of 4,672,030. The rebound therefore came on ordinary participation, rather than a notable surge in trading activity. On-balance volume, which tracks whether volume is flowing more with rising or falling sessions, is rising; that offers a counterpoint to the price downtrend, though it does not override the weaker trend and MACD signals. The 14-day average true range is $14.77, or 6.6% of the share price. This measures typical price movement, not a forecast, and underscores the risk of sharp swings. The lower Bollinger band is $191.77, while its middle line is $258.26. The wide band and low %B reading of 24% place the share price in the lower portion of its recent volatility envelope. The first nearby reference is $210.10 support, close to the three-month low of $208.30. If that area fails, the lower Bollinger band at $191.77 becomes a further reference, not a guaranteed floor. On a recovery, the moving-average zone around $258.26–$261.28 is the first significant test; the 20-day resistance at $307.49 lies further above.Technical Verdict: HOLD
The technical picture supports HOLD (wait & see): the oversold Stochastic and rising OBV leave room for a rebound, but the death cross and negative MACD show that the downtrend remains unconfirmed as a reversal. The verdict is invalidated if price falls below $210.10, the 20-trading-day support.- Entry range: $210.10–$223.35, anchored to the 20-day support and latest price; this is a reference zone, not a forecast.
- Exit target: $258.26–$261.28, the 20-day and 50-day moving-average area.
- Stop-loss protection: $191.77, the lower Bollinger band; a break below $210.10 would already invalidate the stated verdict.
Data table — market data via Yahoo Finance, as of October 27, 2026, 03:00 WIB.
Why ARM is in focus today
- Fresh death cross: SMA20 crossed below SMA50
- Downtrend extending (5-day change -2.06%)
Selected automatically from 32 NASDAQ (US) stocks by a technical-signal score with daily weighted randomisation — not a recommendation.
Summary Data ARM
| Last price | 223.35 USD |
| Change 1 day / 5 days / 1 month | 6.19% / -2.06% / -21.17% |
| Trend / MA-cross | downtrend / death |
| SMA20 / SMA50 | 258.26 / 261.28 |
| RSI (14) / Stochastic %K | 38.3 / 16.3 |
| Bollinger %B / ATR | 24% / 14.77 |
| Support / Resistance 20 days | 210.10 / 307.49 |
| Data as of | 27 October 2026 03:00 WIB |
Disclaimer: This technical analysis is generated automatically from exchange data (via Yahoo Finance) and indicators calculated by JournalArta, for information and education only. The verdict and the entry, target and stop-loss levels are not investment advice or a solicitation to buy or sell any security. Investment decisions and their risks rest solely with the reader.
Track ARM stock price daily: live levels, support/resistance and our full ARM analysis history.