CAT Stock Gains 0.75%, RSI Oversold In Focus
On October 26, 2026: price 692.13 USD, trend downtrend, RSI 28.8, support 687.00, resistance 863.44. technical analysis of cat stock. CAT Stock Gains — full…
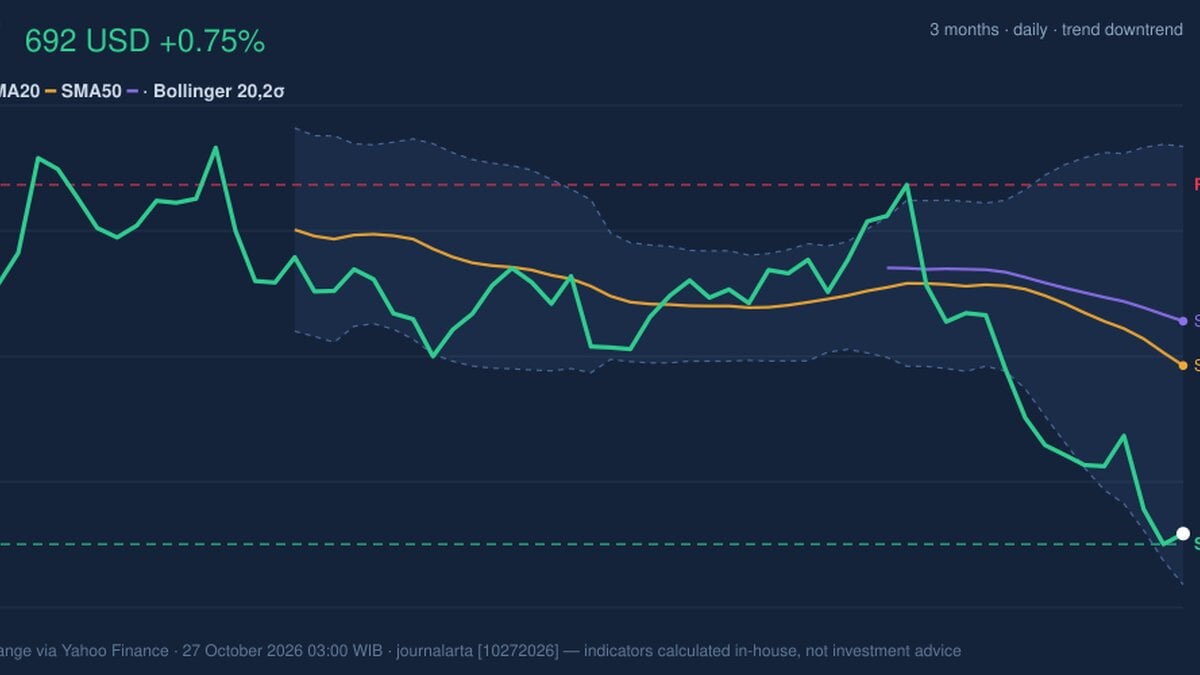
Trend & Price Action
Caterpillar’s price remains below both its 20-day simple moving average (SMA) of $774.66 and its 50-day SMA of $796.45. The 20-day average is falling, with its slope at -3.24% over five trading days. That combination points to persistent selling pressure: short-term weakness is established, and the longer moving average is also overhead. There has been no new moving-average crossover to signal a change in trend. The price is only about 3% above the stated 20-trading-day support of $687.00, while the three-month low stands at $679.50. That proximity makes the area a test of whether buyers will defend the recent floor, not proof that the floor will hold.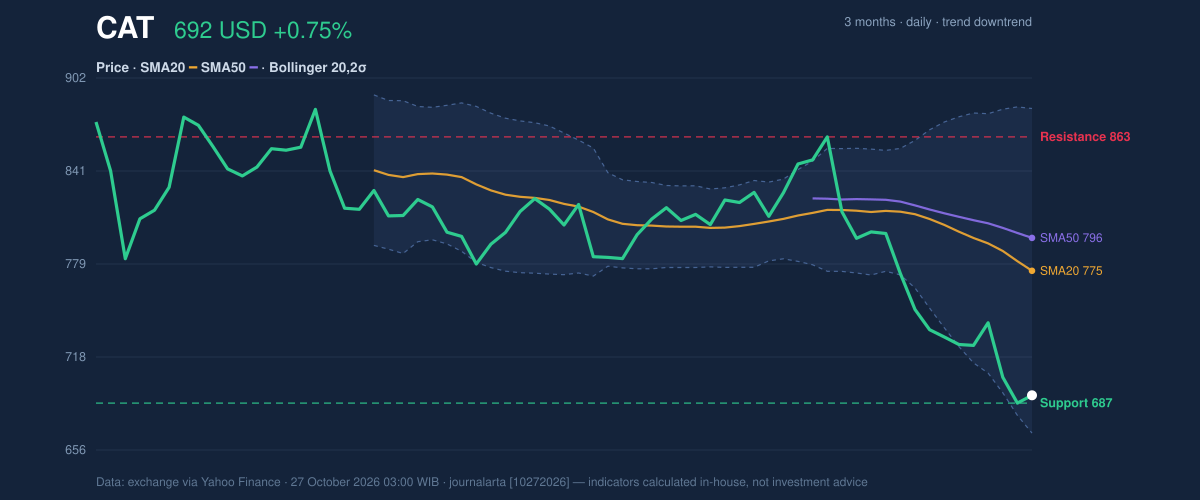
Oscillators & Momentum
The relative strength index (RSI), a measure of recent price momentum, is 28.8, below the commonly watched 30 threshold for an oversold reading. Stochastic %K is 7.6 and %D is 5.1, also in oversold territory. These readings mean selling has been intense relative to recent trading. They can reflect exhaustion, but they are not a reversal signal unless price action begins to confirm one. The moving average convergence divergence (MACD), another momentum measure, remains negative at -30.976, below its signal line at -21.475; its histogram is also negative at -9.501. RSI and Stochastic are oversold, while MACD still confirms negative momentum. The contrast matters: the shares may be vulnerable to a short-term rebound, but the broader momentum evidence has not yet turned positive.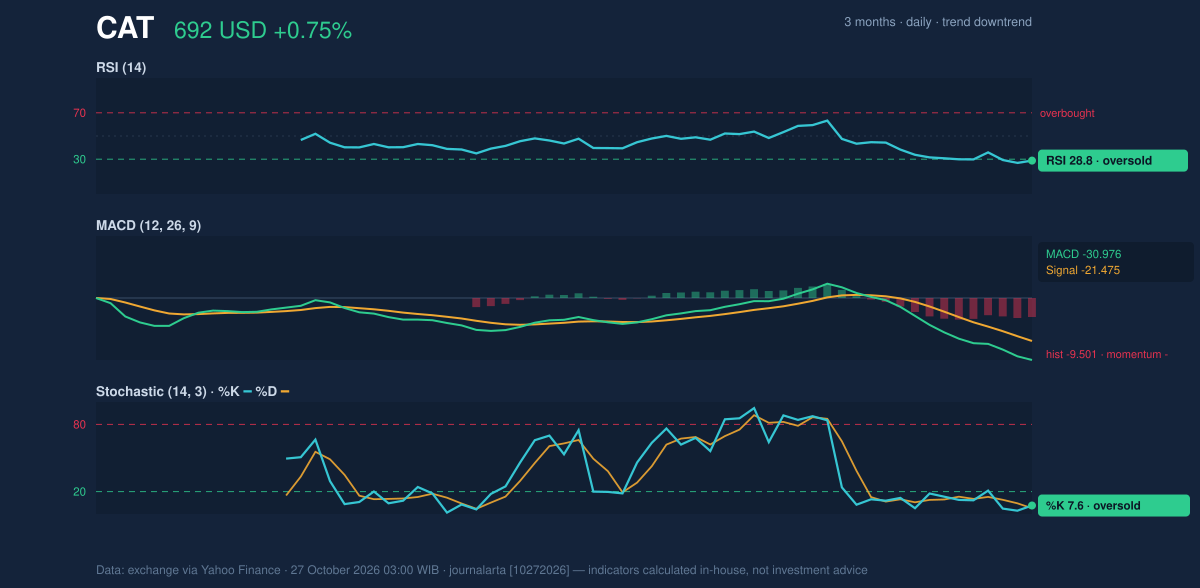
Volatility & Volume
Caterpillar’s price sits near the lower Bollinger Band, with %B at 12%. Bollinger Bands track a stock’s movement around its recent average; a low %B means price is close to the lower edge of that range. The bands are widening, with a width of 27.8%, indicating higher volatility rather than a settled trading pattern. The average true range (ATR), which estimates typical daily price movement, is $28.93, or 4.2% of the share price. That is a large daily range relative to the current price and raises the risk that moves around support could be sharp. Trading volume was 2,312,900 shares, about 0.9 times its 20-day average of 2,653,635, while on-balance volume (OBV)—a measure that tracks whether volume tends to accompany rising or falling prices—was declining. Below-average volume and falling OBV offer little evidence of broad accumulation.Key Levels & Scenarios
The immediate level to watch is $687.00, followed by the three-month low at $679.50. A sustained move below the low would weaken the case that the oversold readings are marking a near-term floor. If support holds, the 20-day SMA at $774.66 is a potential reference on a rebound; the 50-day SMA at $796.45 would be a higher hurdle. The stated 20-day resistance is $863.44, but the gap between current price and those upper levels underscores how far CAT has fallen. The central technical signal is a downtrend pressing against support, with oversold readings raising rebound potential but not yet confirming a reversal.Technical Verdict: HOLD (wait & see)
The technical picture supports a wait-and-see stance: the RSI and Stochastic are oversold, but MACD remains negative; the price is below declining short- and medium-term averages; and falling OBV does not show clear buying accumulation. The verdict is invalidated if the price breaks below $679.50, the three-month low.- Ideal Entry Range: $679.50–$687.00, anchored to the three-month low and 20-day support.
- Exit Target (Target Price): $774.66, the 20-day SMA and a nearby reference if price rebounds.
- Stop Loss: Below $679.50, where a break would put the three-month low behind the price.
Data source: exchange data via Yahoo Finance, as of Oct. 27, 2026, 03:00 WIB.
Why CAT is in focus today
- Trading near its 3-month low (679.50)
- RSI(14) at 28.8 — oversold zone
- Downtrend extending (5-day change -4.64%)
Selected automatically from 30 NYSE (US) stocks by a technical-signal score with daily weighted randomisation — not a recommendation.
Summary Data CAT
| Last price | 692.13 USD |
| Change 1 day / 5 days / 1 month | 0.75% / -4.64% / -15.59% |
| Trend / MA-cross | downtrend / none |
| SMA20 / SMA50 | 774.66 / 796.45 |
| RSI (14) / Stochastic %K | 28.8 / 7.6 |
| Bollinger %B / ATR | 12% / 28.93 |
| Support / Resistance 20 days | 687.00 / 863.44 |
| Data as of | 27 October 2026 03:00 WIB |
Disclaimer: This technical analysis is generated automatically from exchange data (via Yahoo Finance) and indicators calculated by JournalArta, for information and education only. The verdict and the entry, target and stop-loss levels are not investment advice or a solicitation to buy or sell any security. Investment decisions and their risks rest solely with the reader.
Track CAT stock price daily: live levels, support/resistance and our full CAT analysis history.