Golden Cross Formed, CSCO Stock Gains 3.51% on Monday
On October 26, 2026: price 110.24 USD, trend sideways, RSI 50.4, support 104.89, resistance 118.39. technical analysis of csco stock. Golden Cross Formed —…
Why CSCO is in focus today
- One-day move of 3.51%, about 1.3× its average daily range (ATR)
- Fresh golden cross: SMA20 crossed above SMA50
Selected automatically from 32 NASDAQ (US) stocks by a technical-signal score with daily weighted randomisation — not a recommendation.
Trend & Price Action
The golden cross—when the 20-day simple moving average rises above the 50-day average—can signal improving short-term direction. Cisco’s averages are close: the SMA20 is 111.02 and the SMA50 is 110.20. With the share price at 110.24, it sits just above the 50-day average but below the 20-day level. That leaves the crossover constructive, but not yet matched by a clean break above near-term trend resistance. The broader trend is sideways, while the SMA20 has edged up 0.10% over five days. Cisco has gained 3.51% over five days and 3.28% over one month, but the latest rise has brought the stock only 40% of the way through its 20-day support-to-resistance range. That positioning indicates room to test higher levels, though it does not by itself establish a breakout. As shown in the chart, price is still below the Bollinger middle band at 111.02, with the upper and lower bands at 119.55 and 102.49. Bollinger bands map a stock’s movement relative to its recent average; Cisco’s 45% position within the bands is near the middle, not an extreme that would clearly signal stretched momentum. The 15.4% band width is normal, so the data do not point to an unusually compressed setup ahead of a sharp move.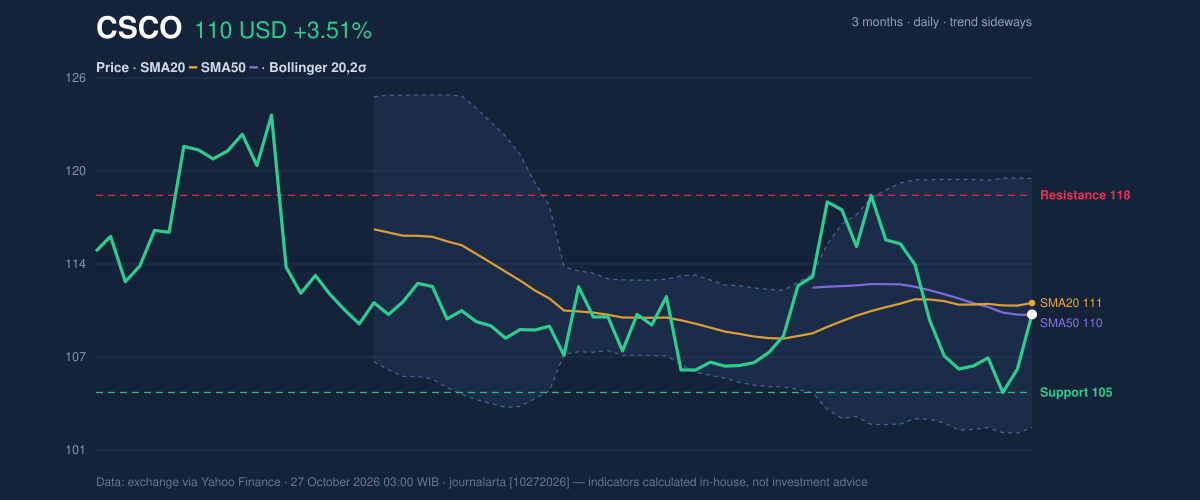
Oscillators & Momentum
Momentum readings are mixed rather than decisively bullish. The RSI is neutral at 50.4; this indicator gauges the strength of recent gains against losses, and a reading near the midpoint suggests neither side has clear control. The Stochastic is also neutral, with %K at 44.2 and %D at 24.1. It tracks where a close sits within a recent price range, offering a short-term view of buying or selling pressure. The MACD, which compares moving averages to assess trend momentum, is less supportive. MACD is negative at -0.960, below its -0.404 signal line, with a -0.556 histogram. That configuration means the momentum measure remains weaker than its signal despite the day’s price rise. The advance may be an early improvement, but the indicators do not yet show broad agreement that upward pressure has taken hold.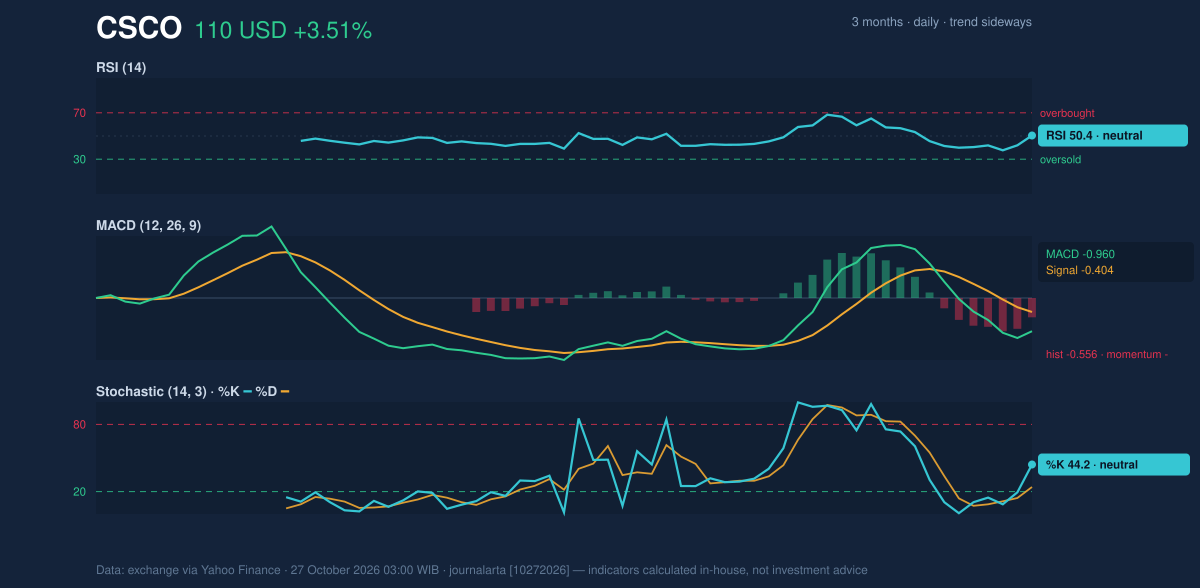
Volatility, Volume & Key Levels
Cisco’s ATR is 3.09, or 2.8% of the share price, indicating moderate recent daily movement. The 3.51% one-day gain is roughly 1.3 times that typical range: a meaningful move, though not proof that the stock has entered a sustained new trend. Volume reached 20,455,000 shares against a 20-day average of 15,481,300. Higher-than-usual turnover gives the rally more weight, but OBV is falling. On-balance volume tracks whether trading volume tends to accompany rising or falling prices; its decline warns that buying participation has not clearly confirmed the advance. The nearest reference points are support at 104.89 and resistance at 118.39, based on the 20-day range. A sustained move above resistance would strengthen the case that the crossover is translating into a broader advance. Failure to hold support would weaken that reading, particularly if the price also slips beneath the three-month low of 103.58. The three-month high is 124.71, but the stock remains below it.Technical Verdict: HOLD (wait & see)
The technical picture is mixed: the golden cross and above-average volume are constructive, but the price remains below its SMA20, MACD momentum is negative, and OBV is falling. The neutral RSI and Stochastic readings reinforce the case for waiting for clearer confirmation rather than treating one strong session as a trend change. This verdict is invalidated if the price falls below 104.89, the stated 20-day support. - Ideal entry range: 110.20–111.02, between the SMA50 and SMA20, as a reference area rather than a confirmed support zone. - Exit target: 118.39, the 20-day resistance. - Stop-loss protection: 104.89, the 20-day support. For non-traders, HOLD means Cisco’s latest rise is notable, but its indicators do not yet agree on a durable direction.| Metric | Reading |
|---|---|
| Last price | 110.24 USD |
| Daily change | +3.51% |
| SMA20 / SMA50 | 111.02 / 110.20 |
| RSI / MACD | 50.4 / -0.960 |
| 20-day support / resistance | 104.89 / 118.39 |
Summary Data CSCO
| Last price | 110.24 USD |
| Change 1 day / 5 days / 1 month | 3.51% / 3.51% / 3.28% |
| Trend / MA-cross | sideways / golden |
| SMA20 / SMA50 | 111.02 / 110.20 |
| RSI (14) / Stochastic %K | 50.4 / 44.2 |
| Bollinger %B / ATR | 45% / 3.09 |
| Support / Resistance 20 days | 104.89 / 118.39 |
| Data as of | 27 October 2026 03:00 WIB |
Disclaimer: This technical analysis is generated automatically from exchange data (via Yahoo Finance) and indicators calculated by JournalArta, for information and education only. The verdict and the entry, target and stop-loss levels are not investment advice or a solicitation to buy or sell any security. Investment decisions and their risks rest solely with the reader.
Track CSCO stock price daily: live levels, support/resistance and our full CSCO analysis history.