On October 26, 2026: price 250.83 USD, trend sideways, RSI 60.8, support 230.88, resistance 252.63. technical analysis of mcd stock. MCD Testing Key Resistance…
By Alistair Sterling
October 27, 20264 min read
MCD Testing Key Resistance
McDonald’s rose 0.95% to $250.83 on the NYSE, putting the stock near the top of its recent trading range even as volume came in below its 20-day average. The move makes the shares worth watching: JournalArta has not covered MCD in the past 14 days, and the latest technical picture combines improving momentum with signs that the advance may be stretched.
Trend & Price Action
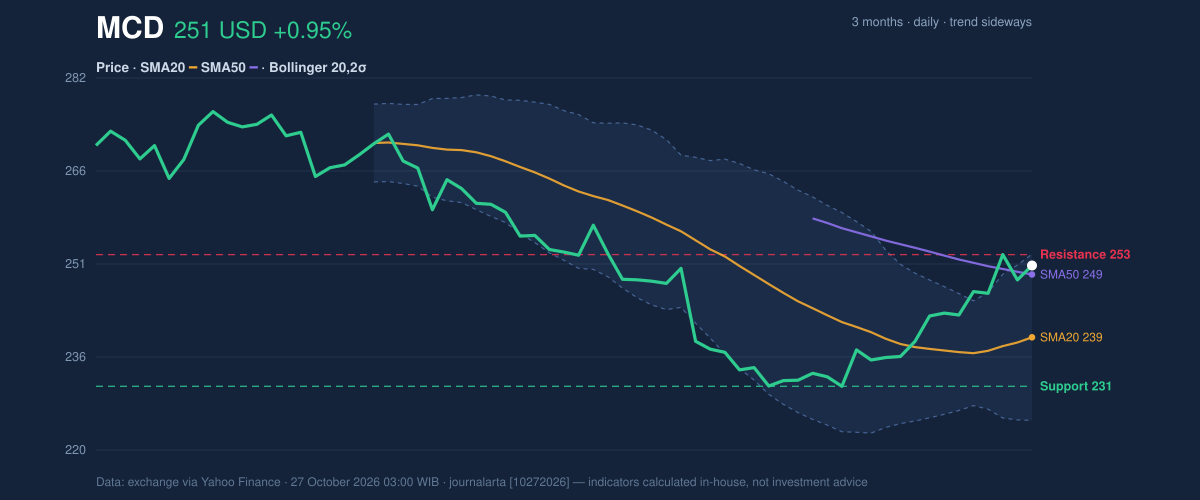
McDonald’s is up 3.36% over five days and 7.38% over one month. Its price is above the 20-day simple moving average (SMA), at $238.99, and slightly above the 50-day SMA, at $249.35. That positioning points to a short-term recovery, but the broader trend remains classified as sideways, with no new moving-average crossover to confirm a lasting change in direction. The 20-day average is rising, a constructive signal, though it does not by itself establish a sustained uptrend.
The shares are at 92% of their 20-trading-day range, between support at $230.88 and resistance at $252.63. They are also close to the upper Bollinger Band at $252.72. Bollinger Bands plot a typical range around an average price; nearing the upper band can signal strong buying pressure, but it can also mean the stock is running ahead of its recent norm. The band width is 11.5%, classified as normal, so the data do not indicate an unusually tight setup or a volatility breakout.
The three-month high and low, $278.70 and $229.20, give the current move more context: MCD has recovered from near the bottom of that span but remains well below its high.
3-month price action chart of MCD: price, SMA20/50, Bollinger, support & resistance. Data: exchange via Yahoo Finance.
Oscillators & Momentum
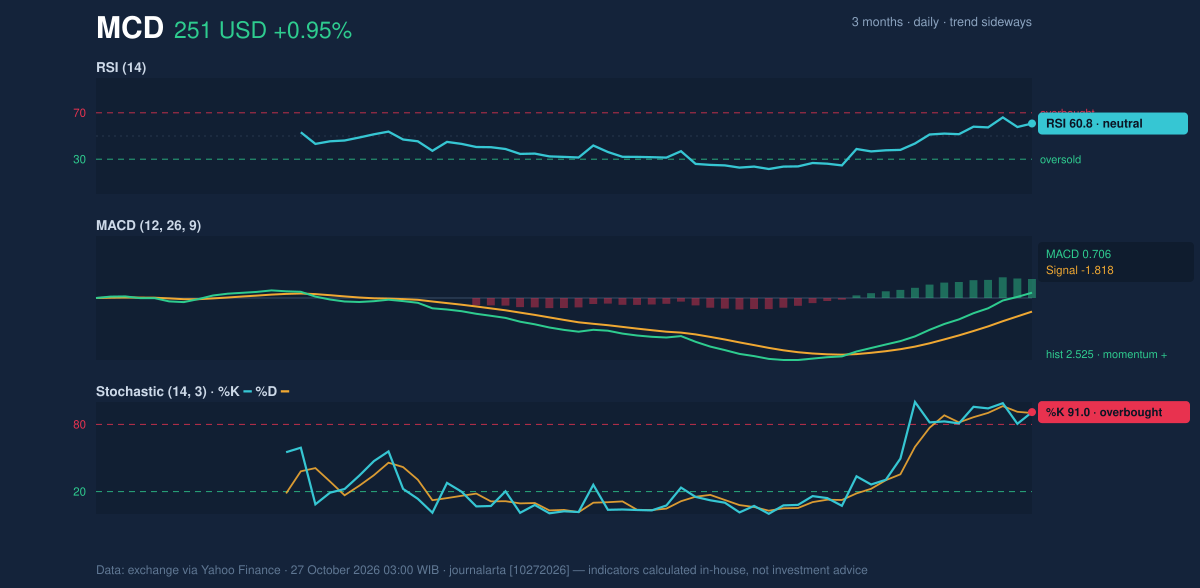
Momentum indicators are positive, but they are not sending an unambiguous signal. The 14-day Relative Strength Index (RSI), which measures the pace of recent gains and losses, is 60.8 and neutral. That suggests buying momentum without the RSI itself indicating an extreme condition.
The Stochastic reading is more cautionary: %K at 91.0 and %D at 90.1 are overbought. An overbought reading means prices have risen rapidly relative to their recent range; it can precede a pause or pullback, but it is not a reliable timing signal on its own. The MACD supports the bullish side of the picture: its histogram is positive at 2.525, while the MACD reading is 0.706 against a signal line of -1.818. The histogram’s positive value indicates improving momentum, though it does not erase the resistance just overhead.
Momentum chart of MCD: RSI(14), MACD, Stochastic. Data: exchange via Yahoo Finance.
Volatility, Volume & Key Levels
Average True Range (ATR), a measure of typical price movement, stands at $4.66, or 1.9% of the share price—moderate volatility by the supplied data. That makes the nearby resistance especially relevant: the upper Bollinger Band and 20-day resistance are only cents apart, leaving little room for the current advance before it must either break through or stall.
Participation offers a mixed confirmation. Volume was 4,736,500 shares, about 0.8 times the 20-day average of 5,693,005. The stock rose on lighter-than-usual trading, so the advance has not yet drawn stronger participation. On the other hand, On-Balance Volume (OBV), which tracks whether volume flows more heavily on rising or falling sessions, is rising—evidence that buying pressure has been building.
A sustained move above $252.63–$252.72 would clear the immediate resistance and upper-band area. Failure there could leave the stock consolidating; a retreat would put the 50-day average at $249.35 and then the 20-day average at $238.99 in focus. A break below $230.88 would undermine the near-term support structure.
Technical Verdict: HOLD (wait & see)
The indicators lean constructive, but the setup is not confirmed enough to resolve the tension between positive momentum and nearby resistance. The rising SMA20 and price above both the SMA20 and SMA50 support the recovery; positive MACD momentum and rising OBV add confirmation. Against that, the overbought Stochastic and sub-average volume raise the risk that the move pauses before resistance is cleared.
The verdict is invalidated if price breaks below $230.88, the 20-trading-day support.
- Ideal Entry Range: $238.99–$249.35, anchored by the SMA20 and SMA50.
- Exit Target (Target Price): $252.63–$252.72, the nearby resistance and upper Bollinger Band.
- Stop Loss protection: Below $230.88, the 20-trading-day support.
In plain English, the chart is improving, but the shares are close to a ceiling and need stronger confirmation.
Data table
Indicator
Reading
Last price
$250.83
SMA20 / SMA50
$238.99 / $249.35
RSI(14)
60.8 (neutral)
Stochastic %K / %D
91.0 / 90.1 (overbought)
MACD histogram
2.525 (positive)
ATR(14)
$4.66 (1.9%)
Volume / 20-day average
4,736,500 / 5,693,005
20-trading-day support / resistance
$230.88 / $252.63
Summary Data MCD
Last price
250.83 USD
Change 1 day / 5 days / 1 month
0.95% / 3.36% / 7.38%
Trend / MA-cross
sideways / none
SMA20 / SMA50
238.99 / 249.35
RSI (14) / Stochastic %K
60.8 / 91.0
Bollinger %B / ATR
93% / 4.66
Support / Resistance 20 days
230.88 / 252.63
Data as of
27 October 2026 03:00 WIB
Disclaimer: This technical analysis is generated automatically from exchange data (via Yahoo Finance) and indicators calculated by JournalArta, for information and education only. The verdict and the entry, target and stop-loss levels are not investment advice or a solicitation to buy or sell any security. Investment decisions and their risks rest solely with the reader.