MELI Testing Support Level: Stock Drops 7.81% (October 26, 2026)
On October 26, 2026: price 1,668.72 USD, trend sideways, RSI 32.6, support 1,668.72, resistance 1,892.44. technical analysis of meli stock.
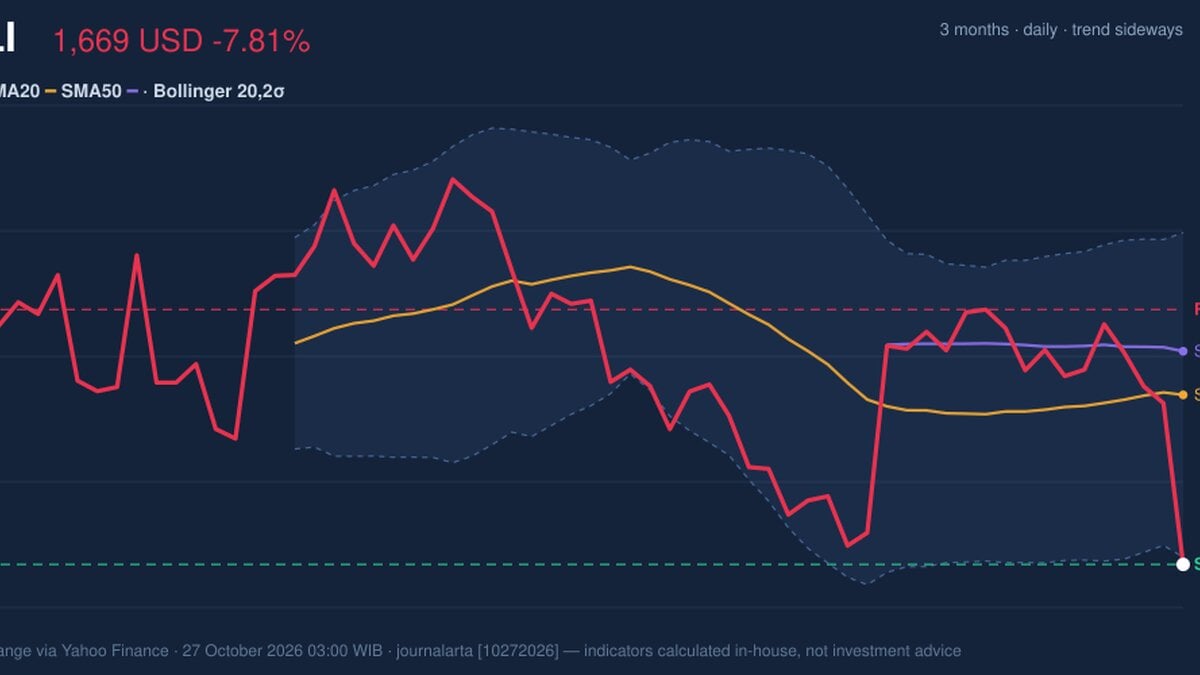
Why MELI is in focus today
- One-day move of -7.81%, about 2.1× its average daily range (ATR)
- Volume at 4.2× the 20-day average
- MACD histogram has just turned negative
Selected automatically from 32 NASDAQ (US) stocks by a technical-signal score with daily weighted randomisation — not a recommendation.
Trend & Price Action
The decline leaves MELI below both its 20-day simple moving average (SMA) of $1,817.48 and its 50-day SMA of $1,855.81. An SMA averages closing prices over a set period, helping show the prevailing direction; trading beneath both suggests recent weakness has overtaken the stock’s short-term trend. The broader classification remains sideways, however, and the 20-day average has edged up 0.53% over five sessions. There has been no new moving-average crossover to confirm a longer-lasting shift. The close also sits just below the Bollinger lower band at $1,675.15. Bollinger bands measure how far prices are moving from a rolling average; a close below the lower band can reflect unusually intense selling, but does not by itself establish that a rebound is due. The band width is 15.7%, described as normal, rather than showing a squeeze or a dramatic volatility expansion. The price is at the bottom of its stated 20-day range, whose resistance is $1,892.44. Its three-month range runs from $1,570.76 to $2,066.00. As shown in the chart, the break below the lower band coincides with a wide gap beneath both moving averages.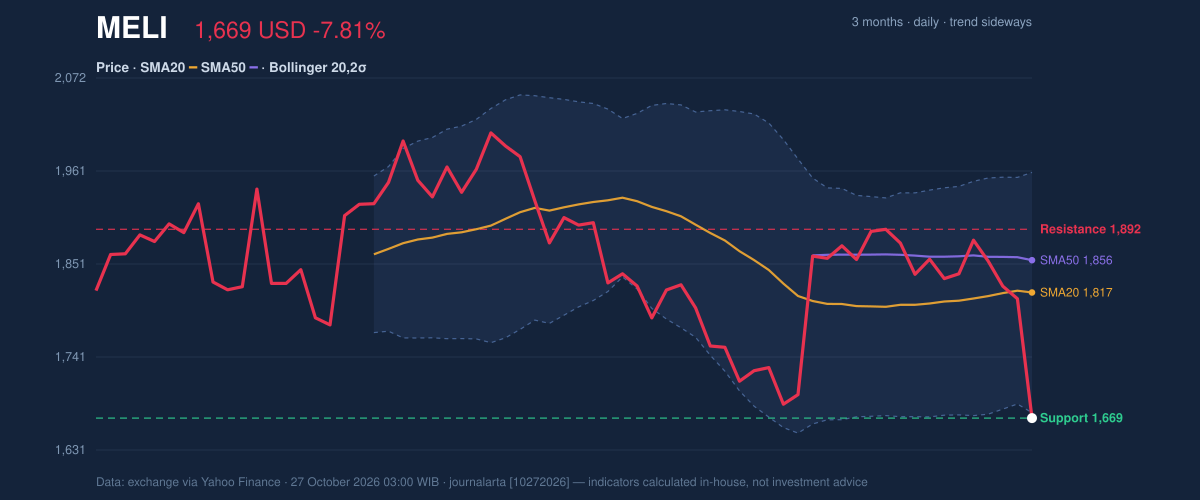
Oscillators & Momentum
The momentum readings are weak but not uniformly decisive. The RSI is 32.6, labelled neutral in the supplied data; the Relative Strength Index gauges the pace of gains and losses, and this reading is near the lower end of its usual scale without being classified here as oversold. The Stochastic readings are also neutral, with %K at 27.7 and %D at 25.6. That indicator compares a recent close with its trading range, and the close-to-bottom position is consistent with pressure, not proof of a turn. The more direct warning comes from MACD momentum turning negative: MACD is -12.793, below its -2.252 signal line, with a -10.541 histogram. The histogram measures the gap between those lines; its negative reading indicates that downward momentum is currently stronger. As shown in the momentum chart, the oscillator readings have not yet supplied a clear counter-signal.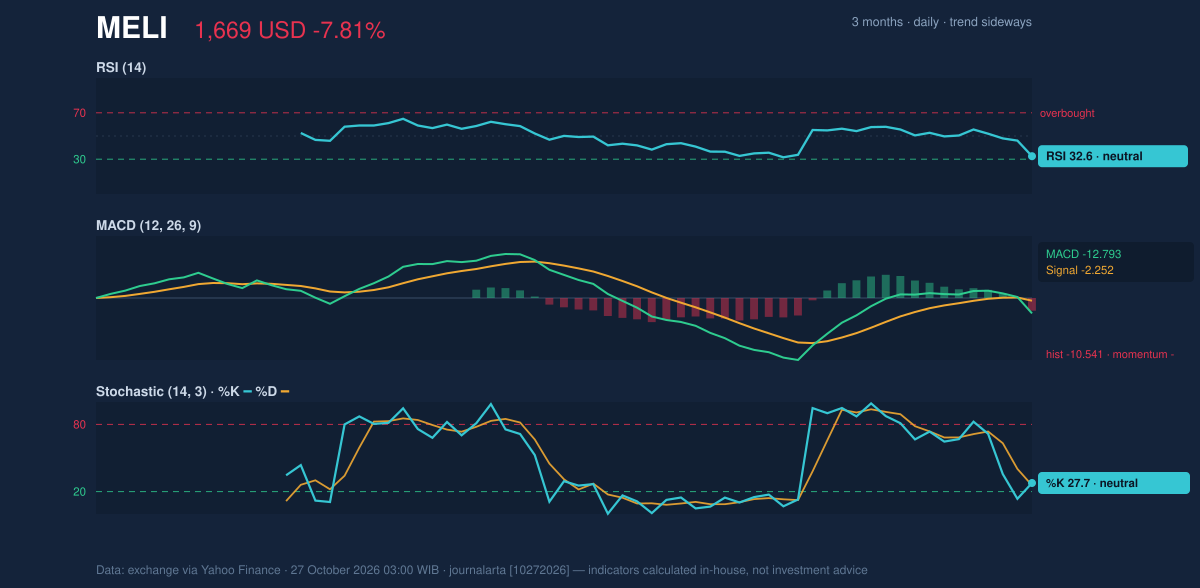
Volatility, Volume & Levels
The session’s volume of 2,410,700 was 4.2 times the 20-day average of 567,290. That surge means the sell-off drew substantially more participation than a typical session; falling OBV, a cumulative measure of volume flow, reinforces the picture of distribution rather than quiet price drift. The ATR is $60.68, or 3.6% of the share price, indicating high day-to-day volatility and wider potential swings. The immediate reference is $1,668.72, the stated 20-day support and the lower edge of the range. Holding there would preserve that reference; a break below would put the three-month low of $1,570.76 in focus. On a recovery, $1,817.48 is the first moving-average barrier, with $1,892.44 the stated resistance. Those levels mark conditions to monitor, not guaranteed turning points.Technical Verdict: HOLD (wait & see)
The indicators lean bearish, but the price is already at the stated support and just beneath the lower Bollinger band, making direction less clear than the negative momentum alone suggests. - Entry range: $1,668.72–$1,675.15, around the stated support and lower Bollinger band. - Exit target: $1,817.48–$1,892.44, from the 20-day average to the stated resistance. - Stop-loss protection: below $1,570.76, the three-month low. - Invalidation: the hold-and-wait view is invalidated if price breaks below $1,570.76. For non-traders, HOLD means the chart shows enough selling pressure to warrant caution, but not enough confirmation to call the next direction.| Metric | Reading |
|---|---|
| Last price | $1,668.72 |
| Daily change | -7.81% |
| SMA20 / SMA50 | $1,817.48 / $1,855.81 |
| RSI / Stochastic | 32.6 / 27.7 and 25.6 |
| MACD histogram | -10.541 |
| Volume vs. 20-day average | 2,410,700 vs. 567,290 |
| Support / resistance | $1,668.72 / $1,892.44 |
Summary Data MELI
| Last price | 1,668.72 USD |
| Change 1 day / 5 days / 1 month | -7.81% / -9.29% / -2.55% |
| Trend / MA-cross | sideways / none |
| SMA20 / SMA50 | 1,817.48 / 1,855.81 |
| RSI (14) / Stochastic %K | 32.6 / 27.7 |
| Bollinger %B / ATR | -2% / 60.68 |
| Support / Resistance 20 days | 1,668.72 / 1,892.44 |
| Data as of | 27 October 2026 03:00 WIB |
Disclaimer: This technical analysis is generated automatically from exchange data (via Yahoo Finance) and indicators calculated by JournalArta, for information and education only. The verdict and the entry, target and stop-loss levels are not investment advice or a solicitation to buy or sell any security. Investment decisions and their risks rest solely with the reader.
Track MELI stock price daily: live levels, support/resistance and our full MELI analysis history.