TSLA Stock Analysis: Gains 5.21%, Testing Key Resistance
On October 26, 2026: price 391.62 USD, trend uptrend, RSI 60.6, support 352.84, resistance 391.62. technical analysis of tsla stock. TSLA Stock Analysis — full…
Trend & Price Action
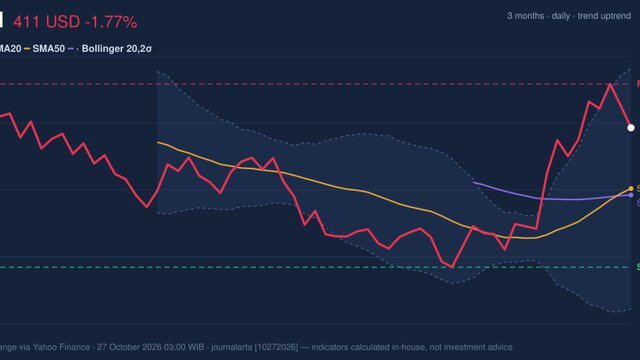
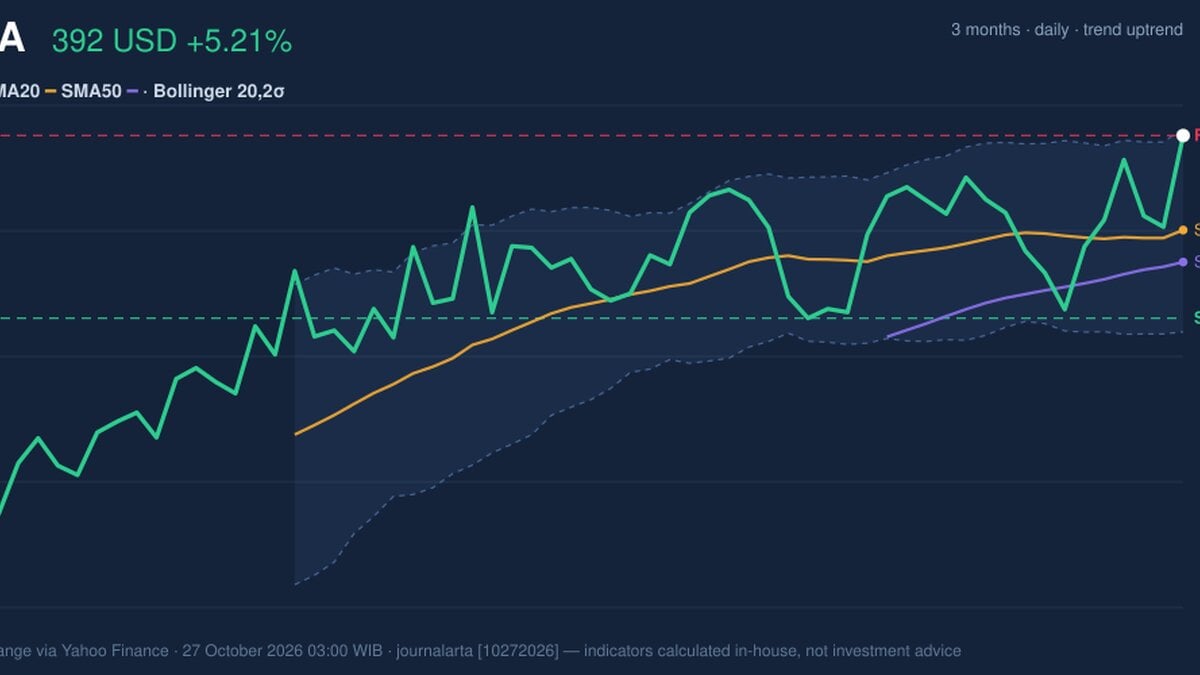
The advance extends a broader uptrend: Tesla’s share price is above its rising 20-day simple moving average (SMA) of $371.58 and its 50-day SMA of $364.76. The 20-day average is climbing 0.43% over five days, suggesting the near-term trend has support from recent price action rather than being driven by a single session alone. There has been no new moving-average crossover, however, so the latest strength is not a fresh long-term trend signal. The stock has gained 9.56% over a month and is now at the top of its 20-day trading range. That positioning matters: a close at the range high shows buyers have pushed through recent trading territory, but it also leaves less room before the next visible test, the three-month high. At $391.62, Tesla is pressing against resistance rather than trading in open space. As shown in the chart, price is near the upper Bollinger Band, which marks a statistical boundary based on recent volatility; it is not, by itself, a forecast that the price must reverse.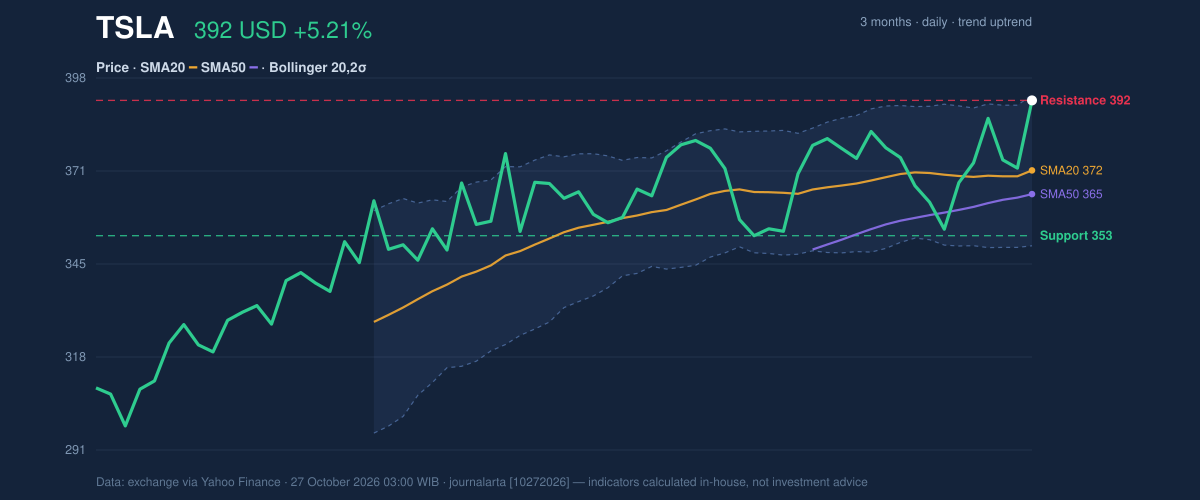
Oscillators & Momentum
Momentum indicators broadly confirm the upswing, though they differ on how stretched it is. The MACD line at 4.479 is above its 3.738 signal line, and its 0.741 histogram is positive. MACD compares shorter- and longer-term price averages; a positive histogram means upward momentum has recently strengthened. The positive MACD reading supports the trend, but does not remove the risk of a pause near resistance. The RSI, or Relative Strength Index, stands at 60.6, a neutral reading that suggests gains have not yet pushed this measure into an extreme zone. The Stochastic oscillator is less restrained: %K is 88.2 versus %D at 70.0, a level flagged as overbought. Stochastic is overbought while RSI remains neutral, a divergence in tone that can occur when prices rise quickly. It points to short-term heat, not a guaranteed reversal.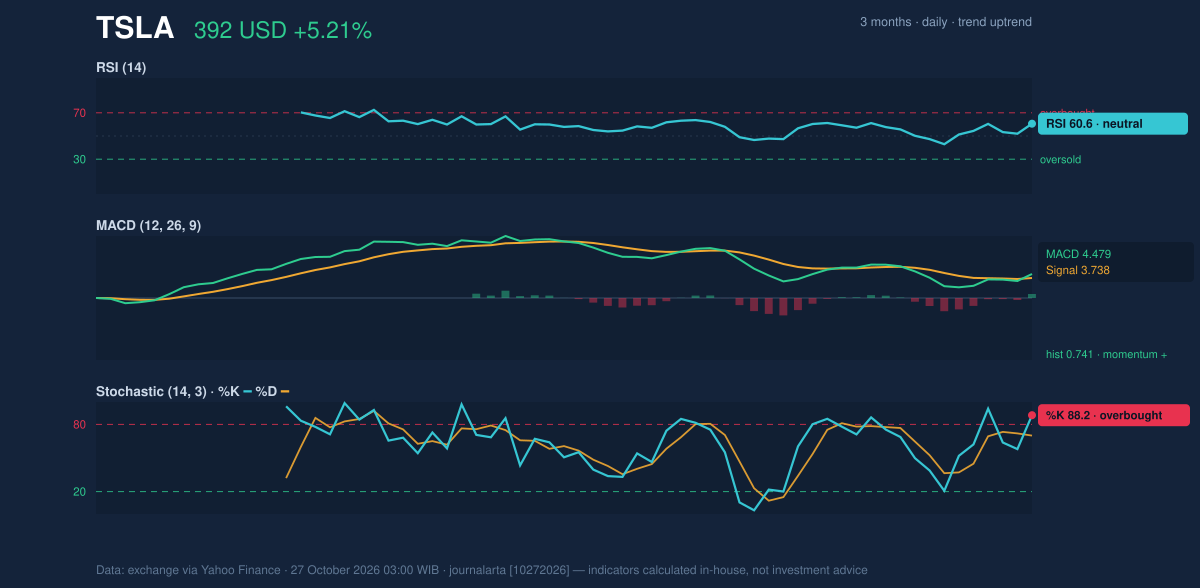
Volatility, Volume & Key Levels
Tesla’s price is near the upper Bollinger Band at $393.20, with %B at 96%. %B shows where the price sits within the band; a reading near 100% places it close to the upper edge. The band width is 11.6%, classified as normal rather than unusually compressed, so the data do not indicate a volatility squeeze that might foreshadow a sharp expansion. ATR is $13.15, or 3.4% of the share price, indicating moderate day-to-day movement. Trading volume was 52,957,700 shares, about 1.4 times its 20-day average of 36,931,600. That higher turnover shows broad participation in the session. But on-balance volume (OBV), a running measure that adds or subtracts volume according to the direction of price moves, is falling. The divergence between higher trading volume and declining OBV tempers the rally’s confirmation: participation was elevated, but the cumulative volume trend is not reinforcing the advance. The nearest marked resistance is $391.62, with the three-month high at $397.27 as the next reference point. Support for the 20-day range sits at $352.84; the rising 20-day average at $371.58 is a nearer trend gauge. A sustained move above $391.62 would put $397.27 in focus, while a failure to hold the rising average would weaken the near-term structure. These are conditional reference levels, not predictions.Technical Verdict: HOLD (wait & see)
The indicators support a qualified hold rather than a clear directional signal. The rising moving averages and positive MACD favor the trend; the overbought Stochastic reading, price near the upper Bollinger Band and falling OBV argue for caution at resistance. The verdict is invalidated if the price falls below the $352.84 support level.- Ideal entry range: $371.58–$364.76, bounded by the 20-day and 50-day SMAs.
- Exit target: $397.27, the three-month high and next overhead reference.
- Stop-loss protection: $352.84, the 20-day range support.
Data: Nasdaq market data via Yahoo Finance, as of October 27, 2026, 03:00 WIB.
Why TSLA is in focus today
- One-day move of 5.21%, about 1.6× its average daily range (ATR)
- Closed at a 20-day high (391.62)
- Trading near its 3-month high (397.27)
- MACD histogram has just turned positive
- Uptrend confirmed (5-day change 6.40%)
Selected automatically from 32 NASDAQ (US) stocks by a technical-signal score with daily weighted randomisation — not a recommendation.
Summary Data TSLA
| Last price | 391.62 USD |
| Change 1 day / 5 days / 1 month | 5.21% / 6.40% / 9.56% |
| Trend / MA-cross | uptrend / none |
| SMA20 / SMA50 | 371.58 / 364.76 |
| RSI (14) / Stochastic %K | 60.6 / 88.2 |
| Bollinger %B / ATR | 96% / 13.15 |
| Support / Resistance 20 days | 352.84 / 391.62 |
| Data as of | 27 October 2026 03:00 WIB |
Disclaimer: This technical analysis is generated automatically from exchange data (via Yahoo Finance) and indicators calculated by JournalArta, for information and education only. The verdict and the entry, target and stop-loss levels are not investment advice or a solicitation to buy or sell any security. Investment decisions and their risks rest solely with the reader.
Track TSLA stock price daily: live levels, support/resistance and our full TSLA analysis history.