ST Engineering Stock Drops 0.20%, Death Cross Pressure In Focus
On October 27, 2026: price 10.16 SGD, trend downtrend, RSI 36.3, support 10.16, resistance 11.23. technical analysis of st engineering stock.
Trend & Price Action
The latest close was below the SMA20 at S$10.54 and the SMA50 at S$10.55. Those averages are nearly level with each other, but the death cross on the latest session marks a shift in their order: the shorter-term average has moved underneath the longer-term one. With the stock at the bottom of its 20-session range, the immediate technical picture is weak, although a low-range position can also leave room for a rebound if selling eases. Support is S$10.16, the 20-session support level and the latest price. A sustained break below it would put the three-month low of S$9.83 in focus. On the upside, resistance is S$11.23; the three-month high is S$11.29. These levels frame the current range rather than guaranteeing where the stock will trade next.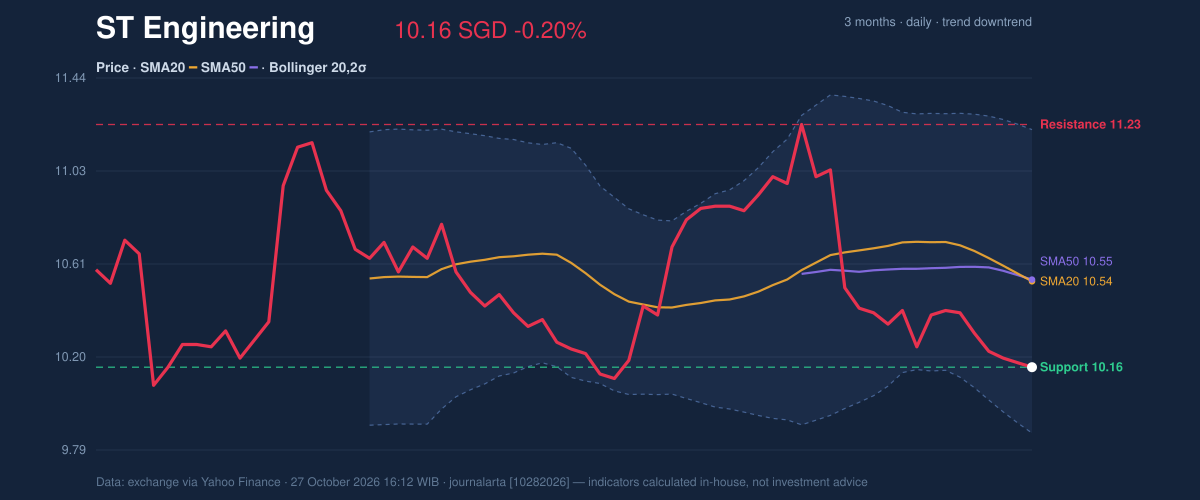
Oscillators & Momentum
Momentum indicators mostly confirm the downward pressure, but they also show that the shares have become stretched. The MACD is negative at -0.119, below its -0.074 signal line, with a negative histogram of -0.045. In plain terms, the faster momentum measure is weaker than its comparison line, consistent with the falling averages. The Stochastic readings of 12.9 and 11.8 are oversold, meaning the price has recently closed near the low end of its trading range. That can precede a bounce, but it is not a reversal signal on its own. The RSI at 36.3 is neutral, below the midpoint commonly used to distinguish stronger from weaker momentum, but not at an extreme that independently confirms a washout.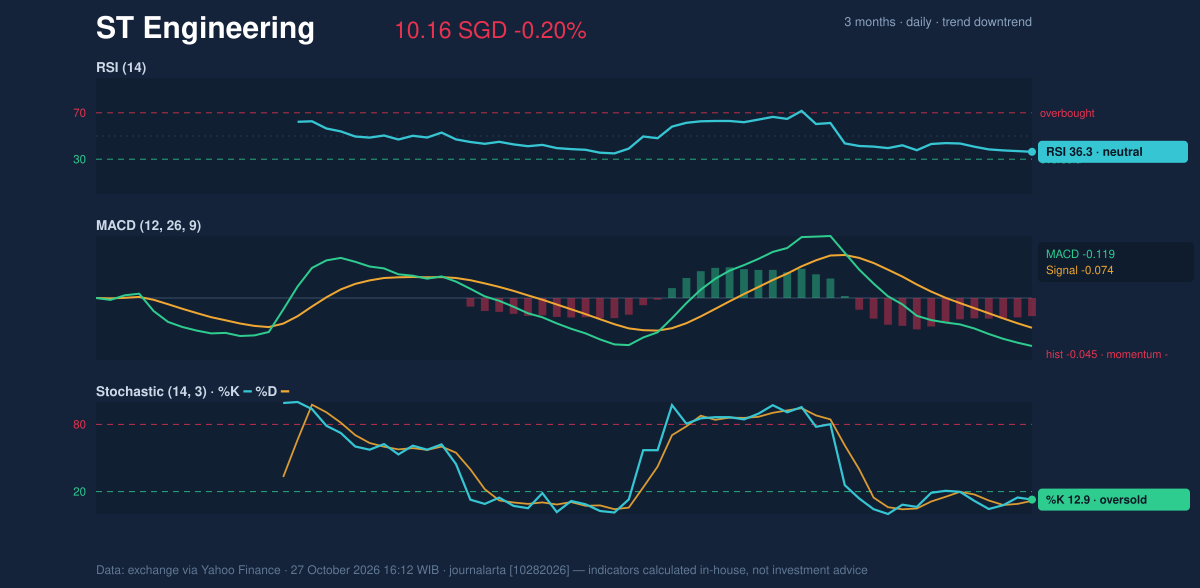
Volatility & Participation
The share price sits at 22% of the Bollinger range, closer to its lower band at S$9.87 than its upper band at S$11.21. The bands’ 12.7% width is classified as normal, so the data do not indicate an unusually tight setup or a major volatility expansion. The lower-band position reinforces the weak price structure, while leaving open the possibility of a short-term rebound if selling pressure fades. Average true range, a measure of typical price movement, is S$0.21, or 2.1% of the share price—moderate volatility. Participation, however, has been subdued: volume was 3,589,200 shares, about 0.8 times the 20-session average of 4,683,642, and OBV was falling. OBV tracks whether volume is flowing more with rising or falling prices; its decline alongside a downtrend offers little evidence of accumulation.Key Levels & Scenarios
A hold at S$10.16 support could provide a base for a recovery, but moving back above the SMA20 and SMA50 near S$10.54–S$10.55 would be a more meaningful test of whether the trend is stabilising. A move toward S$11.23 resistance would require a substantial improvement from the latest close. Conversely, a break below support would expose the three-month low at S$9.83. These are conditional technical scenarios, not forecasts.Technical Verdict: HOLD (wait & see)
The indicators lean bearish, but the oversold Stochastic and the price’s position at support make a clear directional verdict less certain. - Ideal Entry Range: S$9.87–S$10.16, bounded by the lower Bollinger band and 20-session support. - Exit Target (Target Price): S$10.54–S$10.55, the SMA20 and SMA50 area. - Stop Loss protection: Below S$9.83, the three-month low. The verdict is invalidated if the price falls below S$9.83. The technical balance is still weak, but support and oversold readings argue for waiting for clearer confirmation. For non-traders, the chart signals caution: the trend is down, but the share price is testing a level that could either hold or give way.Data: Singapore Exchange market data via Yahoo Finance, as of October 27, 2026.
Why ST Engineering is in focus today
- Fresh death cross: SMA20 crossed below SMA50
- Downtrend extending (5-day change -2.31%)
Selected automatically from 16 SGX (Singapore) stocks by a technical-signal score with daily weighted randomisation — not a recommendation.
Summary Data ST Engineering
| Last price | 10.16 SGD |
| Change 1 day / 5 days / 1 month | -0.20% / -2.31% / -6.36% |
| Trend / MA-cross | downtrend / death |
| SMA20 / SMA50 | 10.54 / 10.55 |
| RSI (14) / Stochastic %K | 36.3 / 12.9 |
| Bollinger %B / ATR | 22% / 0.21 |
| Support / Resistance 20 days | 10.16 / 11.23 |
| Data as of | 27 October 2026 16:12 WIB |
Disclaimer: This technical analysis is generated automatically from exchange data (via Yahoo Finance) and indicators calculated by JournalArta, for information and education only. The verdict and the entry, target and stop-loss levels are not investment advice or a solicitation to buy or sell any security. Investment decisions and their risks rest solely with the reader.
Track ST Engineering share price daily: live levels, support/resistance and our full ST Engineering analysis history.