Vodafone Stock Drops 4.86%, Testing Support Level In Focus
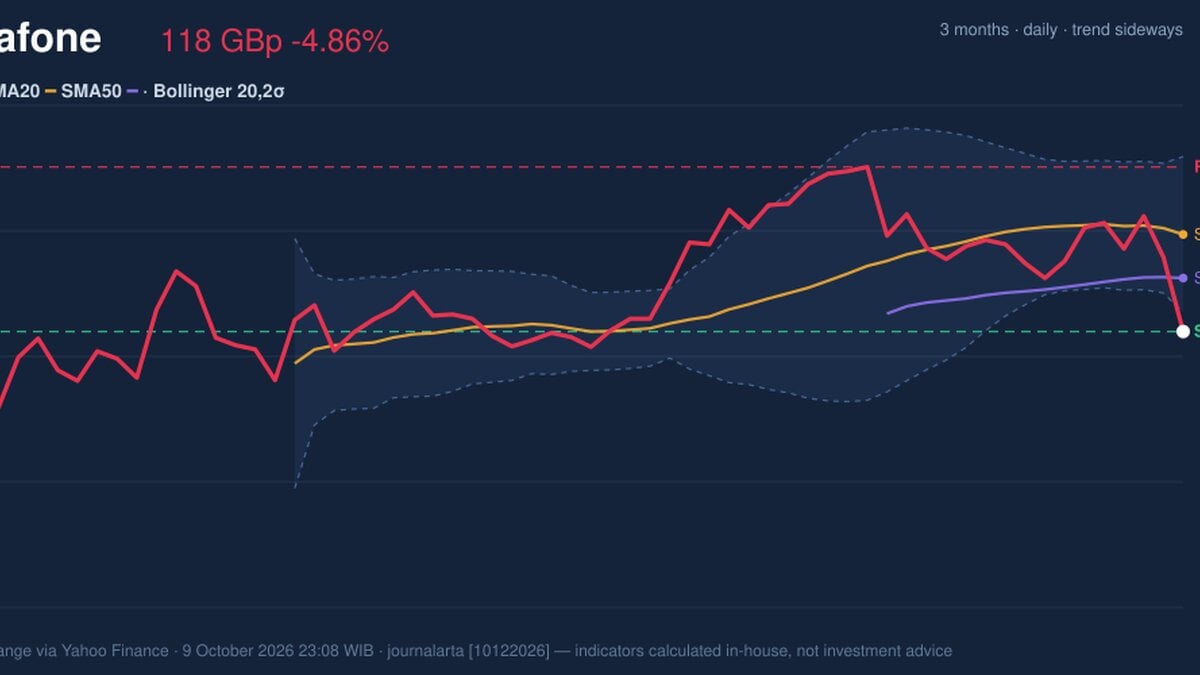
On October 9, 2026: price 118.35 GBp, trend sideways, RSI 39.0, support 118.35, resistance 131.75. technical analysis of vodafone stock.
Why Vodafone is in focus today
- One-day move of -4.86%, about 1.8× its average daily range (ATR)
- Not covered by JournalArta in the last 14 days
Selected automatically from 16 LSE (UK) stocks by a technical-signal score with daily weighted randomisation — not a recommendation.
Trend & Price Action
Vodafone’s price is below both its 20-day simple moving average (SMA20), at 126.25 GBp, and its 50-day average, at 122.71 GBp. A moving average smooths past prices to show direction; trading below both indicates that recent weakness has pushed the shares beneath their short- and medium-term reference levels. The SMA20 is also falling, while there has been no new moving-average crossover. The shares are at the bottom of their 20-trading-day range, with support at 118.35 GBp and resistance at 131.75 GBp. That position makes the current level an immediate test: holding support could steady the decline, while a break below it would mark a new low for the period. The three-month range is wider, from 96.92 GBp to 132.07 GBp, placing the current price much closer to its low than its high. The Bollinger lower band is 119.91 GBp, above the last price, while the %B reading is -12%. Bollinger Bands measure how far a price has moved relative to its recent range; a negative %B shows the shares have slipped below the lower band. That can reflect pronounced short-term weakness, but it does not by itself establish a reversal. The band width is 10.0%, described as normal, so the data do not indicate an unusually compressed or expanding volatility regime.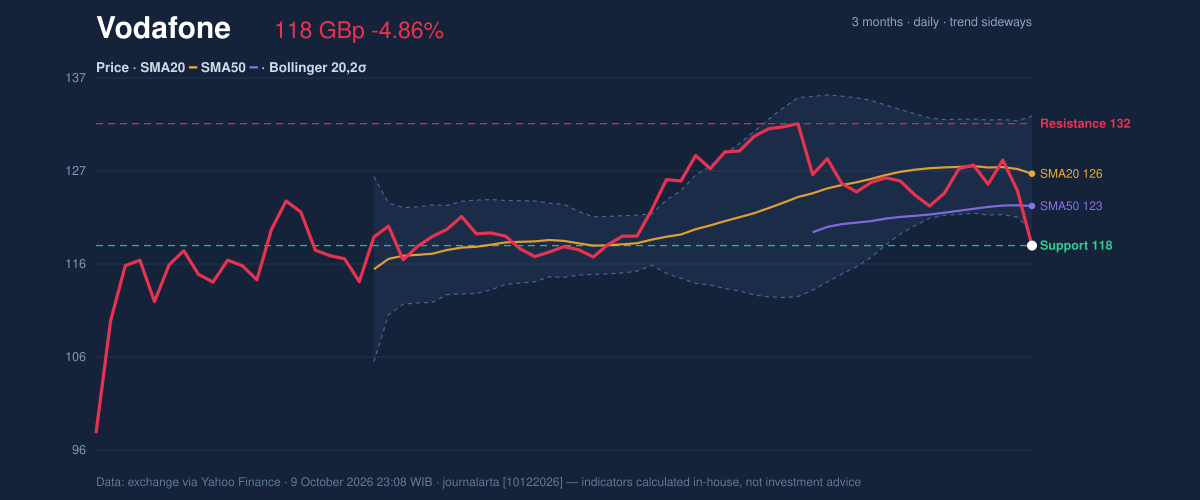
Oscillators & Momentum
Momentum readings are mixed, but the balance remains weak. The RSI is 39.0, a neutral reading, rather than an extreme oversold signal. RSI compares the strength of recent gains and losses; at this level it suggests pressure without showing that selling has reached an unusually stretched condition. The Stochastic %K is 0.0 against %D at 39.6, an oversold signal. Stochastic compares the latest price with its recent trading range, so the reading reflects the share price sitting at the bottom of that range. Oversold conditions can precede a bounce, but they can also persist when a decline is continuing. The MACD histogram is negative at -0.837, with MACD at 0.106 below its 0.943 signal line. MACD tracks changes in price momentum; its negative histogram indicates that downward momentum is still dominant. That makes the Stochastic reading a possible sign of short-term exhaustion, not yet confirmation of a turn.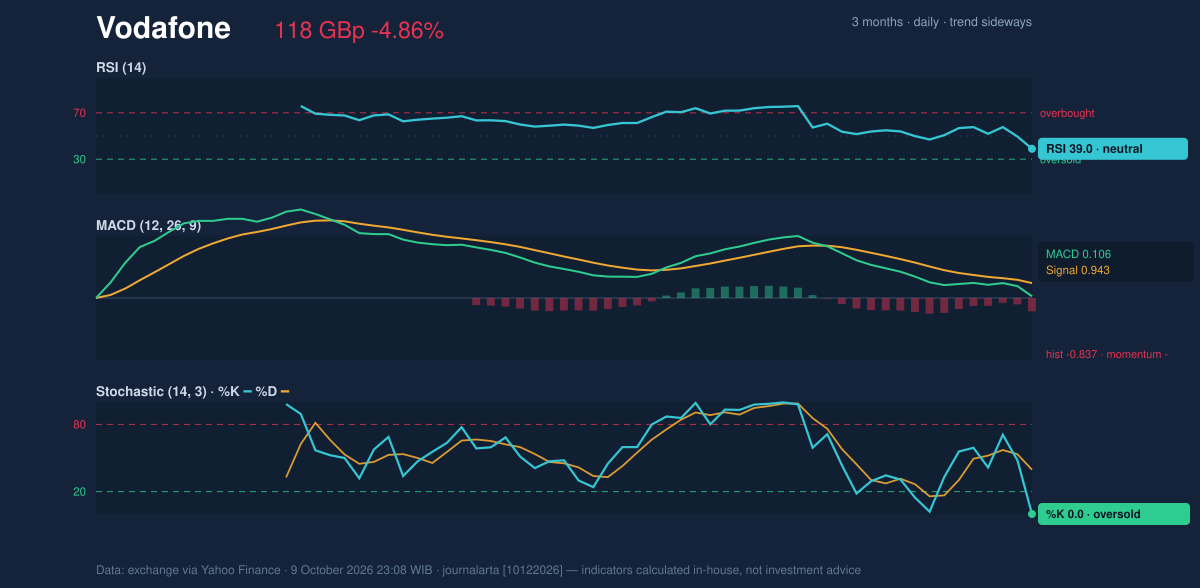
Volatility & Volume
The average true range (ATR) is 3.27 GBp, or 2.8% of the share price, indicating moderate day-to-day volatility. The latest fall was unusually large relative to that typical range, but turnover of 49.2 million shares was only 0.8 times the 20-day average of 62.2 million. On-balance volume (OBV), which tracks whether volume tends to accompany rising or falling prices, is declining. Together, those readings point to weak demand, though the below-average turnover tempers the evidence that the drop was driven by a surge in selling.Key Levels & Scenarios
The immediate reference is 118.35 GBp support, coinciding with the bottom of the 20-day range. A sustained hold could provide a base for a move back toward the lower Bollinger band at 119.91 GBp and then the moving averages. A break beneath support would weaken that scenario. On the upside, 131.75 GBp resistance is the key 20-day ceiling; the SMA20 at 126.25 GBp is an earlier hurdle on any recovery.Technical Verdict: HOLD
The technical reading is cautious rather than directional: price is below both moving averages, the MACD histogram is negative, and OBV is falling. Against that, the Stochastic is oversold, while RSI remains neutral and trading volume is below average. - Ideal entry range: 118.35–119.91 GBp, anchored to 20-day support and the lower Bollinger band; the shares are currently below that band. - Exit target: 126.25 GBp, the SMA20, as the first major moving-average barrier. - Stop-loss reference: Below 118.35 GBp, the 20-day support level. - Invalidation: This HOLD assessment is invalidated if the price breaks below 118.35 GBp. For non-traders, HOLD means the chart shows conflicting signals: the decline remains in place, but an oversold reading leaves room for a short-term bounce.Data Table
| Indicator | Reading |
|---|---|
| Last price | 118.35 GBp |
| Daily change | -4.86% |
| SMA20 / SMA50 | 126.25 / 122.71 GBp |
| RSI(14) | 39.0 |
| Stochastic %K / %D | 0.0 / 39.6 |
| MACD histogram | -0.837 |
| ATR(14) | 3.27 GBp |
| 20-day support / resistance | 118.35 / 131.75 GBp |
| Volume / 20-day average | 49,223,141 / 62,172,894 |
Summary Data Vodafone
| Last price | 118.35 GBp |
| Change 1 day / 5 days / 1 month | -4.86% / -6.66% / -8.08% |
| Trend / MA-cross | sideways / none |
| SMA20 / SMA50 | 126.25 / 122.71 |
| RSI (14) / Stochastic %K | 39.0 / 0.0 |
| Bollinger %B / ATR | -12% / 3.27 |
| Support / Resistance 20 days | 118.35 / 131.75 |
| Data as of | 9 October 2026 23:08 WIB |
Disclaimer: This technical analysis is generated automatically from exchange data (via Yahoo Finance) and indicators calculated by JournalArta, for information and education only. The verdict and the entry, target and stop-loss levels are not investment advice or a solicitation to buy or sell any security. Investment decisions and their risks rest solely with the reader.
Track Vodafone share price daily: live levels, support/resistance and our full Vodafone analysis history.