CRM Testing Key Resistance: Stock Gains 2.90% (Agustus 4, 2026)
On Agustus 4, 2026: price 185.95 USD, trend sideways, RSI 59.6, support 156.93, resistance 188.38. technical analysis of crm stock. CRM Testing Key Resistance…

Salesforce (CRM) rose to 185.95 USD on the NYSE, up 2.90% in the latest session and 13.62% over five days, according to Yahoo Finance data for 31 July 2026. The move matters because it has carried the stock to the upper edge of its recent range, where momentum can either extend or stall.
Trend & Price Action
The chart shows CRM trading above its SMA20 at 170.62 and above its SMA50 at 171.03, which tells traders the stock has recovered enough to sit above both short- and medium-term trend gauges. But the broader picture is still best described as sideways, not a clean uptrend, because there is no fresh MA-cross to signal a new trend regime.
That distinction matters. When a stock is above both moving averages but the averages themselves are not producing a new crossover, it often means buyers have the upper hand for now, yet the market has not fully committed to a sustained breakout. The slope of SMA20 at 3.20% over 5 days shows the shorter trend is improving, but it is still doing so inside a range rather than in a decisive trend channel.
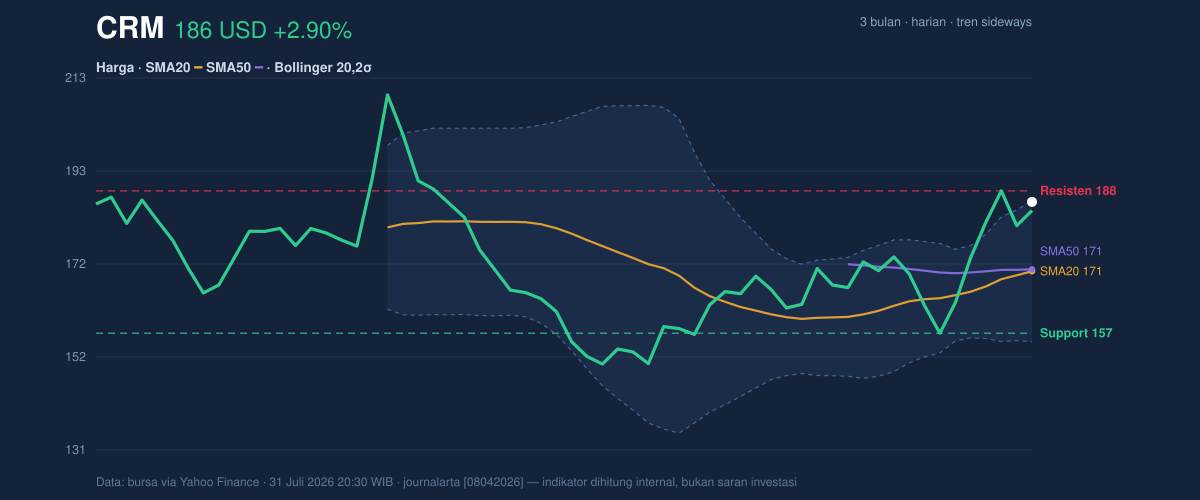
The latest close also sits very near the upper Bollinger band, with 186.22 on top and the price at 185.95. That placement suggests the stock is pressing against the ceiling of its normal volatility envelope. In plain language, the market is paying up for the shares, but it is also leaving less room before the move starts to look stretched.
Oscillators & Momentum
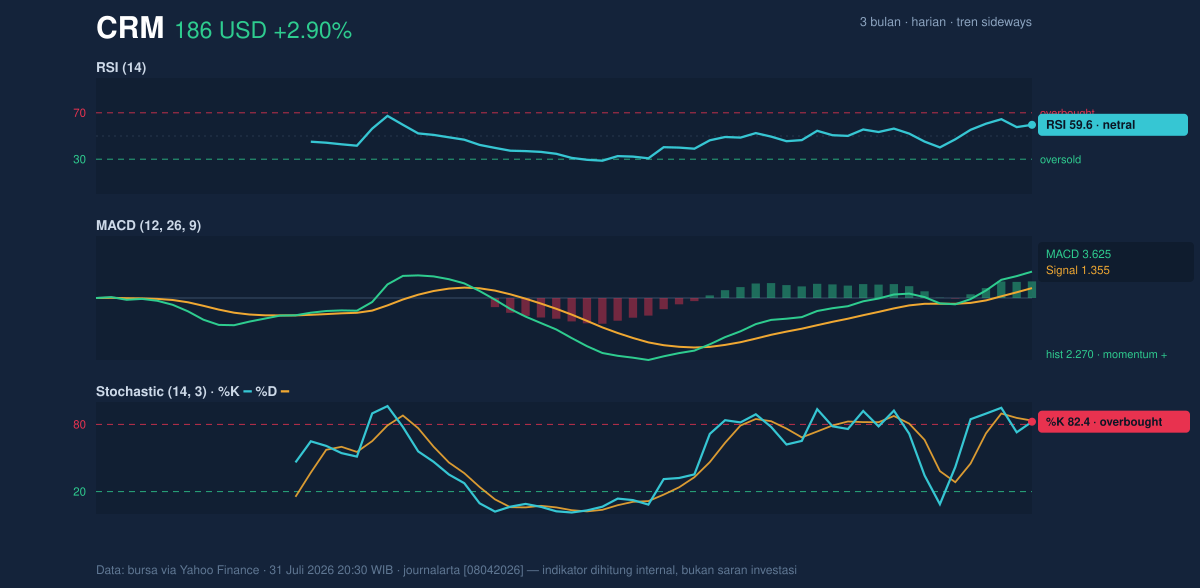
Momentum is positive, but not uniform. The MACD at 3.625 is above its signal line at 1.355, and the histogram at 2.270 shows that bullish momentum is still expanding. In technical terms, that means recent price gains have been strong enough to keep the trend-following indicator aligned with the advance.
At the same time, the shorter-term oscillator is flashing caution. The Stochastic %K at 82.4 and %D at 83.4 are both in overbought territory, which does not mean the stock must fall immediately, but it does mean the rally is running close to a level where short-term traders often start taking profits. The RSI at 59.6 is still neutral, so the stock is not yet in a classic overbought RSI condition. That combination is important: RSI says the move is healthy enough, while Stochastic says the near-term stretch is becoming more crowded.
This mix usually points to a market that is constructive but vulnerable to pauses. Strong MACD plus stretched Stochastic often means the trend is intact, yet the next leg higher may need either a brief consolidation or a fresh catalyst to avoid fading.
Volatility & Volume
Volatility is not especially compressed. The ATR at 8.87, or 4.8% of price, indicates the stock can still move meaningfully in either direction on a normal day. The Bollinger band width of 18.3% is described as normal, so this is not a squeeze setup where a sudden breakout is being tightly coiled. Instead, the stock is already trading near the top of its recent volatility band, which can make the next move more sensitive to order flow.
Volume gives a mixed signal. The latest turnover of 9,691,500 was below the 20-day average of 12,769,425, or about 0.8x normal. That means the advance is not being powered by unusually heavy participation. In practical terms, the rally has enough support to push price higher, but not enough volume confirmation to make the move look broad-based and emphatic.
Still, OBV is rising, and that is a constructive background signal. OBV, or on-balance volume, tracks whether volume is accumulating on up days or down days. A rising OBV suggests money flow has been leaning toward buyers even if the latest session did not come with standout volume. As shown in the chart, the price is holding near the top of its range, and rising OBV supports the idea that dips have been bought.
Key Levels & Scenarios
The nearest technical floor is support at 156.93, while the closest overhead barrier is resistance at 188.38. CRM is already trading at 92% of its 20-hour range, which means it is much closer to resistance than support. That positioning often leaves less reward for new buyers unless the stock can clear the ceiling.
The three-month range adds context: the stock is still below the 3-month high of 211.34 and well above the 3-month low of 146.32. So CRM has recovered from the lower end of its broader range, but it has not yet reclaimed the upper breakout zone. If price pushes through 188.38, the market would be signaling that the recent advance is more than a short-lived bounce. If it fails there, the stock could rotate back toward the middle of the band near 170.62, where both the SMA20 and Bollinger midline sit.
Technical Verdict: HOLD (wait & see)
HOLD (wait & see)
- MACD is positive and still expanding, which supports the current advance.
- Stochastic is overbought and price is pressing the 186.22 Bollinger upper band, so the stock looks extended in the short term.
- Volume is only 0.8x normal, which weakens confirmation for a clean breakout above 188.38.
Verdict invalidated if price falls below 156.93.
- Ideal entry range: 170.62 to 171.03
- Exit target: 188.38
- Stop loss protection: 156.93
In plain English: the stock is firm, but it is close enough to resistance that the next move needs proof before the trend can be trusted.
Summary Data CRM
| Last price | 185.95 USD |
| Change 1 day / 5 days / 1 month | 2.90% / 13.62% / 11.94% |
| Trend / MA-cross | sideways / none |
| SMA20 / SMA50 | 170.62 / 171.03 |
| RSI (14) / Stochastic %K | 59.6 / 82.4 |
| Bollinger %B / ATR | 99% / 8.87 |
| Support / Resistance 20 days | 156.93 / 188.38 |
| Data as of | 31 Juli 2026 20:30 WIB |
Track CRM stock price daily: live levels, support/resistance and our full CRM analysis history.


