Testing Key Resistance, DBS Stock Drops 1.12% Today
On Oktober 1, 2026: price 77.50 SGD, trend sideways, RSI 54.2, support 76.75, resistance 78.65. technical analysis of dbs stock. Testing Key Resistance — full…

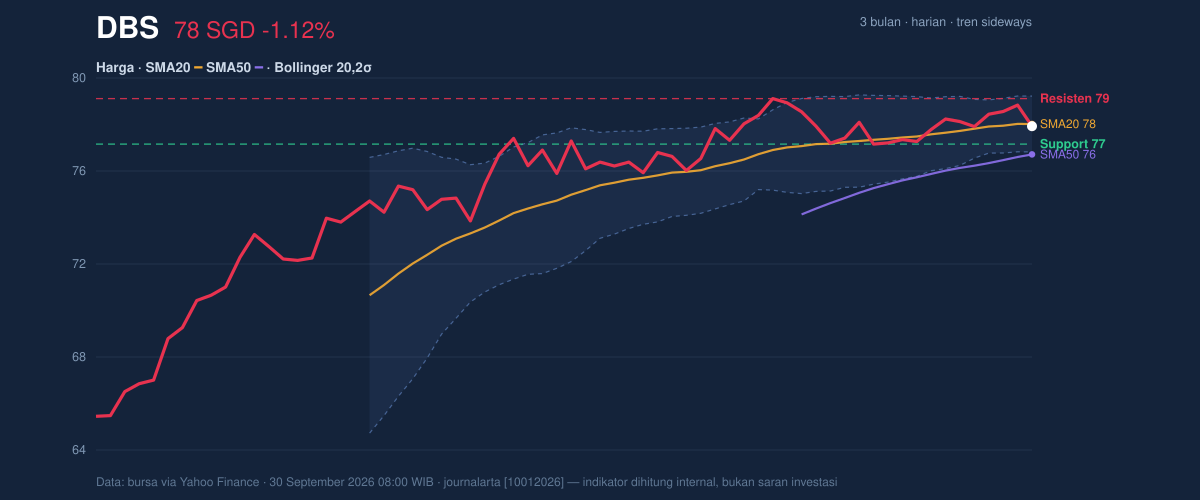
DBS Group’s shares slipped to SGD 77.50 on 30 September 2026, down 1.12% from the previous close of 78.38, but the move sits inside a broader sideways pattern rather than a clean trend break. The stock is trading just below its SMA20 at 77.59 and above its SMA50 at 76.32, a positioning that suggests the medium-term floor is still intact even as near-term momentum cools. What matters here is not the small daily decline on its own, but the way price is hovering around the short-term average while volatility compresses — a setup that often precedes a sharper move once one side of the range gives way.
Trend & Price Action
The chart shows DBS sitting in the middle of a well-defined band, with the price at SGD 77.50 versus support at 76.75 and resistance at 78.65. That places the stock in the lower half of its recent range, at about 39% of the band, which means sellers have had the upper hand recently, but not enough to force a decisive breakdown. The broader picture is still constructive enough to avoid calling it a downtrend: the SMA20 is rising at 0.37% over 5 days, the SMA50 at 76.32 remains below price, and there has been no fresh MA-cross to signal a new trend regime.
That combination usually signals balance, not conviction.
The key message from the price structure is that DBS is compressing under short-term resistance while holding above a longer moving average. If price can reclaim the short-term average and push through the upper band, the chart would begin to look less like drift and more like an expansion phase. If it cannot, the market is telling us the stock is still being capped by overhead supply.
Oscillators & Momentum
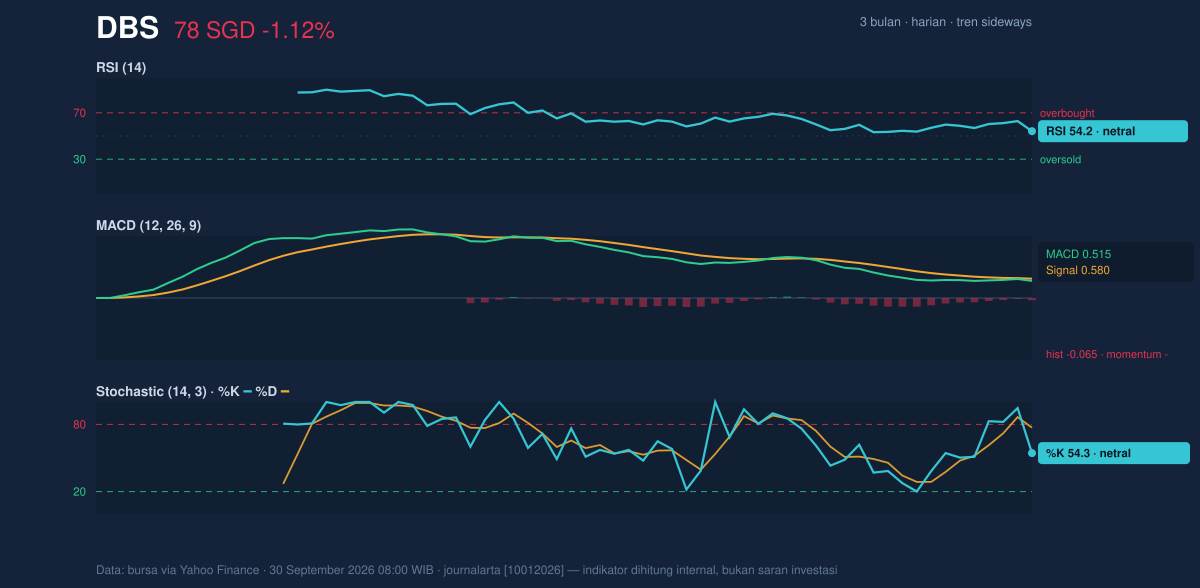
Momentum is mixed, and that is the most important signal in the indicator set. The RSI at 54.2 is neutral, which means DBS is neither overbought nor oversold; it is simply not stretched enough to force a reversal. The Stochastic %K at 54.3 and %D at 77.0 are also neutral, but the gap between the two suggests short-term momentum has eased from a stronger reading and is no longer leading price higher with force. The clearest warning comes from the MACD at 0.515 below its signal at 0.580, with a histogram of -0.065. In plain English, that means the recent upward impulse has weakened: the trend is not collapsing, but the pace of advance has faded.
This is the kind of setup that often produces a pause before the next directional move.
Volatility & Volume
Volatility is subdued. The ATR(14) at 0.92, equal to 1.2% of price, says the stock is not moving with wide daily swings right now. At the same time, the Bollinger Bands are narrow, with a 3.0% width and the price sitting at %B 46% near the middle of the band. That combination is important: a squeeze in the bands often reflects a market waiting for a catalyst, because compressed volatility can lead to a sharper breakout once orders accumulate on one side.
Volume adds a more encouraging note. The latest session saw 5,941,100 shares traded, about 1.6× the 20-hour average of 3,630,982, while OBV is rising. That pairing usually means participation is improving even if price has not yet resolved the range. In other words, the market is active beneath the surface, and the volume profile is not consistent with a sleepy, low-interest name.
Key Levels & Scenarios
The immediate map is straightforward. Support at 76.75 is the first line that matters because it sits close to the lower Bollinger band at 76.43 and just above the SMA50 at 76.32. A break below that zone would weaken the current base and suggest the market is losing its ability to defend the mid-70s. On the upside, resistance at 78.65 sits just under the upper Bollinger band at 78.75 and below the 3-month high of 79.05, making it the gatekeeper for any attempt to retest the recent peak.
If price holds above 76.75 and volume stays elevated, the chart would favor a range expansion toward the upper boundary. If it fails to hold 76.75, the lower band and the 50-day average become the next technical test.
Technical Verdict: HOLD (wait & see)
- Reason 1: RSI 54.2 and Stochastic 54.3/77.0 are neutral, so momentum is not strong enough to justify a directional call.
- Reason 2: MACD 0.515 below signal 0.580 with a -0.065 histogram shows momentum has turned mildly negative.
- Reason 3: Bollinger squeeze and ATR 0.92 point to compression, while OBV rising and 1.6× volume show participation is building but not yet resolved.
- Invalidation: this verdict is invalidated if price breaks and stays below 76.75.
- Ideal Entry Range: 76.75–77.59
- Exit Target: 78.65–78.75
- Stop Loss protection: below 76.43
For non-traders: DBS is not flashing a strong trend signal right now; it looks like a stock waiting for the next decisive move, with the market watching whether 76.75 holds or 78.65 gives way.
Summary Data DBS
| Last price | 77.50 SGD |
| Change 1 day / 5 days / 1 month | -1.12% / -0.24% / -0.13% |
| Trend / MA-cross | sideways / none |
| SMA20 / SMA50 | 77.59 / 76.32 |
| RSI (14) / Stochastic %K | 54.2 / 54.3 |
| Bollinger %B / ATR | 46% / 0.92 |
| Support / Resistance 20 days | 76.75 / 78.65 |
| Data as of | 30 September 2026 08:00 WIB |


