Shell Stock Technicals Today: Drops 0.47%, Momentum Gains
On September 30, 2026: price 3,594.00 GBp, trend uptrend, RSI 65.7, support 3,431.50, resistance 3,654.50. technical analysis of shell stock.

Shell plc edged lower on the London Stock Exchange on 28 September 2026, with the shares last changing hands at 3,594.00 GBp, down 0.47% on the day, even as the broader technical picture still points to an established uptrend. The move matters because it came after a 3.02% gain over 5 days and a 7.46% rise over 1 month, so the pullback looks more like a pause than a break in character. But the details beneath the headline are less straightforward: price is holding above the short- and medium-term trend lines, momentum is positive, and yet participation has softened, which can leave a rally vulnerable if buyers do not return soon.
Trend & Price Action
Shell remains above both its SMA20 at 3,536.05 and SMA50 at 3,413.12, a simple but important sign that the market is still paying a premium for the shares relative to recent history. In plain terms, the stock is trading above the average prices that many chart watchers use to judge whether a move is healthy or fading. The uptrend is also supported by the SMA20 slope of 1.71% over 5 days, which suggests the nearer-term trend is still rising rather than flattening out.
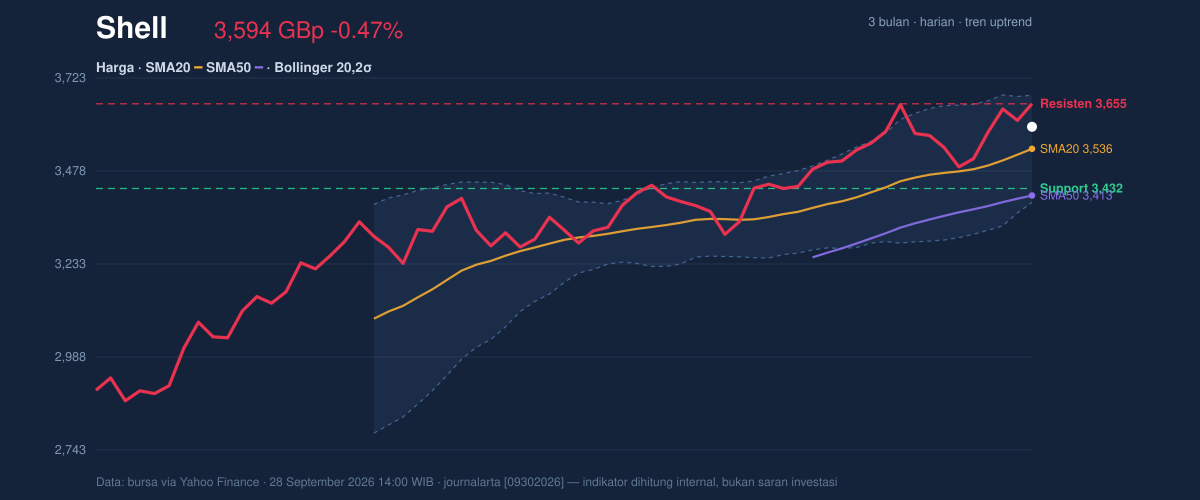
The price sitting near 73% of the 20-hour range tells a useful story: Shell is not stretched at the very top of its band, but it is also no longer sitting in bargain territory. That positioning matters because it leaves less room before resistance becomes relevant. The nearest support at 3,431.50 and resistance at 3,654.50 frame the current battle zone, while the 3-month high of 3,681.50 sits just above resistance and the 3-month low of 2,559.50 remains far below, underscoring how much the share price has recovered from earlier weakness.
Oscillators & Momentum
Momentum is still constructive, but it is no longer uniformly calm. The RSI(14) at 65.7 is described as neutral, which means the stock is not yet in a classic overbought extreme, though it is clearly leaning toward the stronger end of the range. That is reinforced by the Stochastic %K at 88.6 and %D at 84.9, both in overbought territory, which often signals that the latest leg higher has moved quickly and may need to cool before it can extend further.
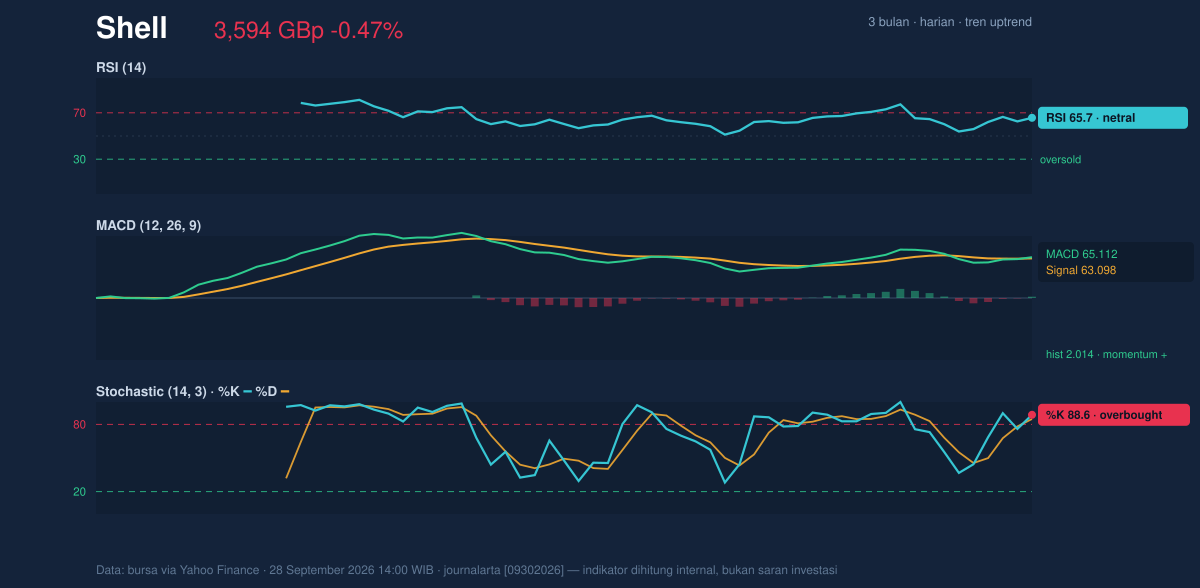
The MACD at 65.112 above its signal line at 63.098, with a histogram of 2.014, shows that upward momentum is still ahead of the signal trend. In practical terms, that means the stock’s recent rise is still being confirmed by trend-following momentum rather than rejected by it. The tension is that oscillators are now split: MACD says the move is alive, while Stochastic says it is getting extended. That combination often appears when a rally is healthy but nearing a point where fresh demand must appear to keep the move going.
Volatility & Volume
The Bollinger setup is one of the more interesting signals here. Price is trading above the middle band at 3,536.05 and below the upper band at 3,677.18, with %B at 71%. That places Shell in the upper half of its recent volatility envelope without yet pressing the ceiling. More importantly, the 8.0% band width is described as a squeeze, which usually means volatility has compressed and the next move could be sharper than recent day-to-day trading suggests. Squeezes do not predict direction on their own, but they often precede expansion, so the market may be setting up for a cleaner break either through resistance or back toward the middle band.
Volume, however, is not confirming the enthusiasm. The latest turnover of 6,320,621 was only 0.6× the 20-hour average of 11,031,312, and OBV is falling. That combination matters because rising prices on lighter volume can mean the move is being led by fewer participants. In a stock as large and closely watched as Shell, weak volume does not automatically reverse a trend, but it does reduce conviction. The chart’s message is that price is still climbing, yet the crowd behind the move has thinned.
Key Levels & Scenarios
The immediate technical map is straightforward. 3,654.50 is the first level to watch on the upside, because a clean move through that ceiling would bring the 3,677.18 Bollinger upper band and the 3,681.50 3-month high into view almost immediately. On the downside, 3,536.05 is the first structural support, since it matches the SMA20 and the Bollinger middle band, while 3,431.50 is the deeper support that would matter if the short-term trend starts to slip.
The current setup suggests a market that is still biased upward but increasingly sensitive to disappointment. If price can hold above the SMA20 and push through resistance with better participation, the squeeze in Bollinger width argues for a faster extension than the recent drift. If it fails to hold the middle band, the move would look less like consolidation and more like a momentum fade.
Technical Verdict: HOLD (wait & see)
HOLD (wait & see)
- MACD remains positive, with the line above the signal and a positive histogram, so the underlying trend is still intact.
- Price is above SMA20 and SMA50, which keeps the broader structure constructive.
- Stochastic is overbought and volume is weak at 0.6× average, so upside follow-through is not yet well confirmed.
- Verdict invalidated if price falls below 3,431.50, because that would break the nearest support and weaken the current trend structure.
- Ideal Entry Range: 3,536.05 to 3,431.50
- Exit Target: 3,654.50 to 3,677.18
- Stop Loss protection: below 3,431.50
For non-traders, this means Shell still looks technically healthy, but the chart is asking for proof before the next leg higher. “The market is still in our favour, but it is not yet shouting confidence.”
Summary Data Shell
| Last price | 3,594.00 GBp |
| Change 1 day / 5 days / 1 month | -0.47% / 3.02% / 7.46% |
| Trend / MA-cross | uptrend / none |
| SMA20 / SMA50 | 3,536.05 / 3,413.12 |
| RSI (14) / Stochastic %K | 65.7 / 88.6 |
| Bollinger %B / ATR | 71% / 68.35 |
| Support / Resistance 20 days | 3,431.50 / 3,654.50 |
| Data as of | 28 September 2026 14:00 WIB |

