Shell Share Price Technicals: Falls 2.07% on Tuesday, Testing Support Level
Technical analysis of Shell stock on November 10, 2026: price 3,624.50 GBp, trend sideways, RSI 35.4, support 3,624.50, resistance 4,038.00.
Why Shell is in focus today
- Volume at 1.7× the 20-day average
- Closed at a 20-day low (3,624.50)
Selected automatically from 98 LSE (UK) stocks by a technical-signal score with daily weighted randomisation — not a recommendation.
Trend & Price Action
Shell fell 6.19% over five days and 6.23% over one month, extending a decline that has put its shares below both the 20-day moving average of 3,889.50 GBp and the 50-day average of 3,712.67 GBp. The 20-day average itself fell 0.38% over five days. That points to a weak short-term trend, even as the broader trend classification remains sideways. There has been no new moving-average crossover to signal a decisive shift in direction. The shares ended below the Bollinger lower band of 3,669.03 GBp, with a %B reading of -10%. This means the price has moved outside the range defined by the band, a sign of unusually strong downward pressure—not, by itself, proof that a rebound is due. The band width is 11.3%, classified as normal, so the move is not being accompanied by an exceptionally narrow volatility setup. As shown in the chart, the gap between the current price and the moving averages illustrates how far Shell has slipped from its recent trend levels. The session’s finish also sits at the bottom of the 20-day range, while the three-month low of 3,253 GBp remains below it.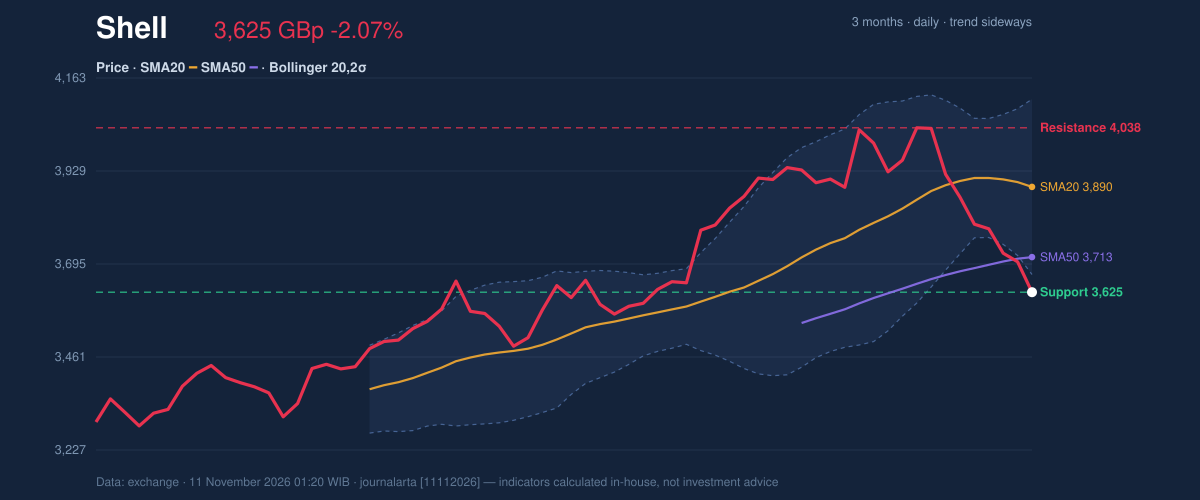
Oscillators & Momentum
The momentum indicators are weak but not fully aligned. RSI is 35.4, in the stated neutral zone, close to—but not inside—the conventional oversold area. Stochastic readings of 7.5 for %K and 10.5 for %D are oversold, indicating that the decline has been steep relative to the recent trading range. Oversold conditions can precede a pause or rebound, but they do not establish that selling has ended. The MACD histogram is negative at -50.282, with the MACD at 0.219 against a signal reading of 50.501. The negative histogram indicates downward momentum remains in place. Together, the indicators show short-term selling pressure, with Stochastic weakness more pronounced than the RSI reading suggests.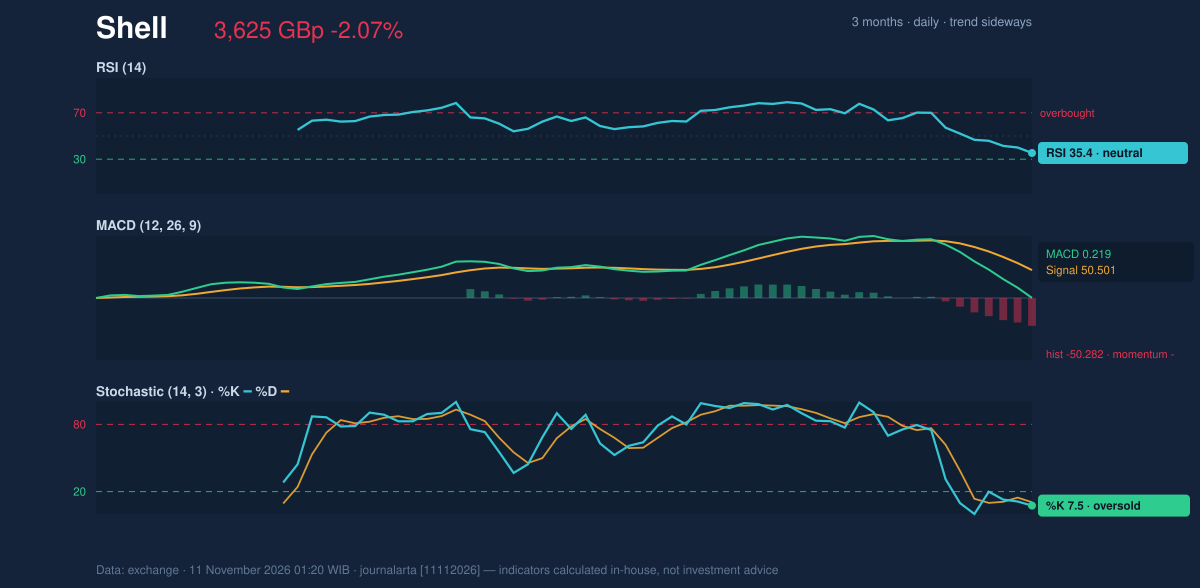
Volatility & Volume
Volume reached 15,507,386 shares, compared with a 20-day average of 9,033,078. That 1.7-times surge matters because it came on a falling session and alongside a close at the 20-day low. It suggests broader participation in the decline rather than a move occurring on unusually quiet trading. OBV, which tracks whether volume is flowing more with rising or falling prices, also declined, offering no sign of accumulation. ATR stands at 97.25 GBp, or 2.7% of the share price, indicating medium volatility. In practical terms, moves of meaningful size are possible within ordinary trading conditions, so a brief bounce would not necessarily reverse the price structure.Key Levels & Scenarios
The immediate reference point is support at 3,624.50 GBp, the 20-day low and the session’s closing price. A close below that level would extend the breakdown and put the three-month low at 3,253 GBp in focus. A move above resistance at 4,038 GBp, the 20-day resistance, would be a more substantial sign that sellers are losing control; the three-month high is 4,110 GBp. The technical signals are tilted lower: there were zero bullish and two bearish signals. Those bearish signals include a close below the 20-day low on volume at least 1.5 times average, and a Bollinger squeeze resolving with a close below the lower band. The latter describes a range tightening before a move that then broke downward; it reinforces the weakness but does not dictate how far the move will travel.Technical Verdict: HOLD (wait & see)
JournalArta Research’s verdict is HOLD (wait & see), with a score of -41 on a scale from −100 to +100. The call reflects the mixed picture rather than a lack of risk: Shell is below its 50-day average, the five-day decline is sharp, and bearish signals outnumber bullish ones, while RSI remains above the stated 30–50 oversold boundary. - Conditional entry range: 3,770.38–4,038 GBp, as an upside scenario only if the price closes above 20-day resistance; 3,770.38 GBp is the reference level of price plus 1.5 times ATR. - Exit target: 4,110 GBp, the three-month high, if an upside break is sustained. - Stop-loss protection: 3,478.63 GBp, the reference level of price minus 1.5 times ATR, for that upside scenario. The verdict is invalidated if Shell breaks below 3,624.50 GBp; the lower support would then become the more immediate concern. For non-traders, the reading is that Shell’s chart remains under pressure, but confirmation of the next direction is still needed.Summary Data Shell
| Last price | 3,624.50 GBp |
| Change 1 day / 5 days / 1 month | -2.07% / -6.19% / -6.23% |
| Trend / MA-cross | sideways / none |
| SMA20 / SMA50 | 3,889.50 / 3,712.67 |
| RSI (14) / Stochastic %K | 35.4 / 7.5 |
| Bollinger %B / ATR | -10% / 97.25 |
| Support / Resistance 20 days | 3,624.50 / 4,038.00 |
| Data as of | 11 November 2026 01:20 WIB |
| JournalArta research verdict (score) | Hold (-41) |
Today's full Buy and Sell list for UK, Singapore & Hong Kong stocks →
Disclaimer: This technical analysis is generated automatically from exchange data and indicators calculated by JournalArta, for information and education only. The verdict and the entry, target and stop-loss levels are not investment advice or a solicitation to buy or sell any security. Investment decisions and their risks rest solely with the reader.
Track Shell share price daily: live levels, support/resistance and our full Shell analysis history.