BP Share Price Analysis: Falls 0.81%, Testing Support Level
Technical analysis of BP stock on November 10, 2026: price 552.20 GBp, trend sideways, RSI 35.2, support 552.20, resistance 638.50.

Why BP is in focus today
- Volume at 1.6× the 20-day average
- Closed at a 20-day low (552.20)
- Not covered by JournalArta in the last 14 days
Selected automatically from 98 LSE (UK) stocks by a technical-signal score with daily weighted randomisation — not a recommendation.
Trend & Price Action
BP closed below both its 20-day simple moving average (SMA), at 602.01 GBp, and its 50-day average, at 577.86 GBp. A moving average smooths daily price swings; trading below both indicates that recent weakness has pulled the share price beneath its short- and medium-term trend markers. The 20-day average has fallen 1.02% over five days, reinforcing that pressure. There is no new moving-average crossover. The 20-day average remains above the 50-day average, but that historical ordering has not prevented the price from falling. In other words, the averages offer a mixed signal: their relative position is not bearish, while the share price and the short-term slope are weak. The price is at the lower Bollinger Band, 550.46 GBp, with %B at 2%. Bollinger Bands are a range derived from recent price volatility; a reading near the lower edge shows that BP is trading close to the bottom of that range. It can reflect strong selling pressure, but does not, on its own, establish a reversal. The band width is 17.1%, described as normal, rather than signaling an unusually tight volatility squeeze. As shown in the chart, the share is at the lower end of its 20-session range, with resistance at 638.50 GBp. The three-month range runs from 512.70 to 638.54 GBp.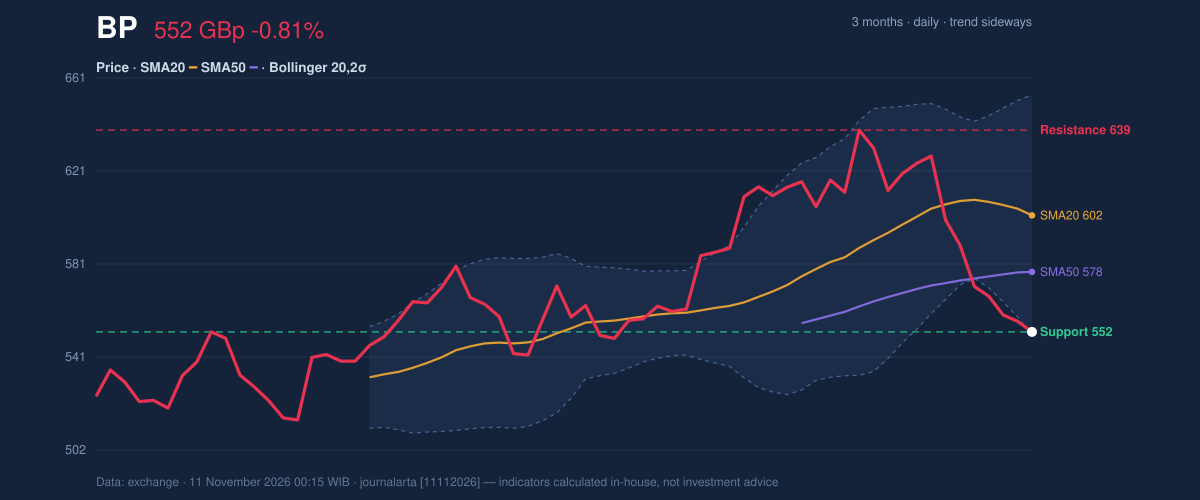
Oscillators & Momentum
Momentum readings remain mixed, but the balance tilts negative. The RSI is 35.2, in the neutral zone specified by the data: it is weak, but has not reached the stated oversold threshold. The Stochastic is oversold, with %K at 12.1 and %D at 11.3. This can mean the decline has been rapid; it is not confirmation that buyers have returned. The MACD is negative, with a -9.632 histogram, while its value of -5.120 sits below the 4.512 signal line. The histogram measures the gap between the MACD line and signal line; its negative reading indicates that downward momentum is prevailing. That contrasts with the oversold Stochastic, which flags stretched selling rather than a confirmed turn.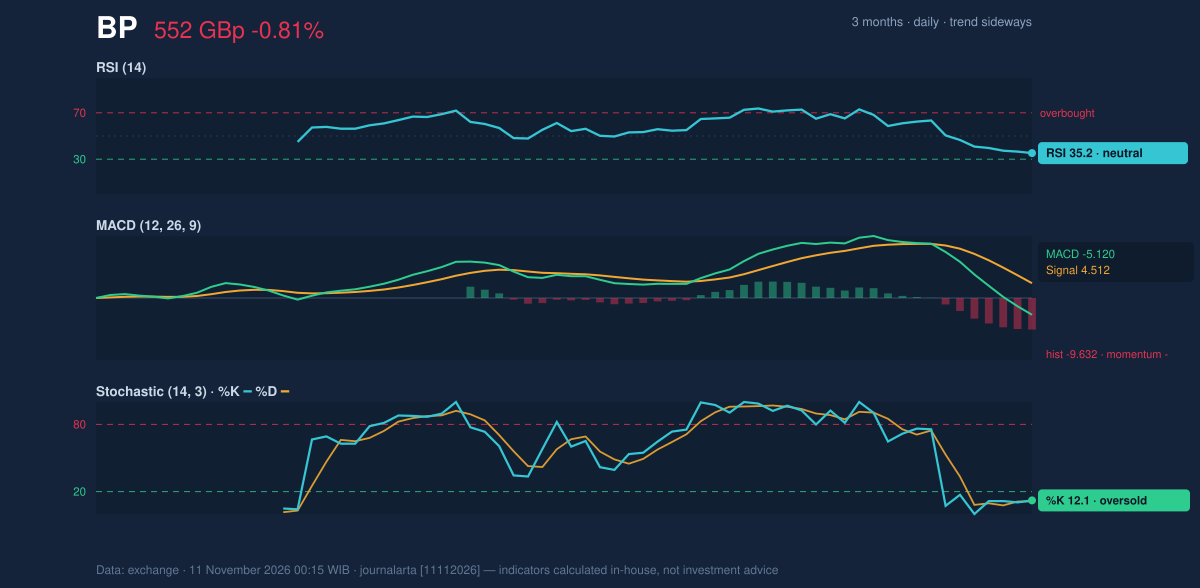
Volatility, Volume & Levels
The 14-session average true range (ATR), a measure of typical price movement, is 18.60 GBp, or 3.4% of the share price—moderate volatility by the supplied classification. Yet the session’s volume was 1.6 times its average and the on-balance volume (OBV) indicator fell. OBV tracks whether volume is flowing more with rising or falling prices; its decline alongside the down day supports the view that selling had meaningful participation. Support stands at 552.20 GBp and resistance at 638.50 GBp. Support is the level where buying has previously met selling; resistance marks an area where gains have previously stalled. Since the share closed exactly at support, a break below it would put the 524.30 GBp reference level—price minus 1.5 times ATR—in focus. If support holds, 580.10 GBp, price plus 1.5 times ATR, is a nearer conditional recovery reference; a stronger advance would still face the 20-session resistance.Technical Verdict: HOLD (wait & see)
HOLD (wait & see) is the JournalArta Research verdict, with a score of -33 on a scale from −100 to +100. The reasons are the close below the 50-day average, negative MACD momentum, and a 6.30% five-session decline on above-average volume. The oversold Stochastic is a counter-signal, but it does not yet align with the broader price and momentum picture. The verdict is invalidated if BP breaks below 552.20 GBp, its 20-session support. - Conditional entry range: above 638.50 GBp, only if the price closes above 20-session resistance. - Conditional target price: 638.54 GBp, the three-month high, in that upside scenario. - Stop-loss protection: 552.20 GBp for the upside scenario; a break below it instead marks the downside case, with 524.30 GBp as the supplied ATR-based reference. For non-traders, HOLD means the signals do not yet agree on whether BP’s decline is stabilizing or continuing. | Technical data | Reading | |---|---:| | Last price | 552.20 GBp | | Change | 1 day −0.81% · 5 days −6.30% · 1 month −9.48% | | SMA20 / SMA50 | 602.01 / 577.86 GBp | | RSI / Stochastic | 35.2 / oversold | | MACD histogram | −9.632 | | ATR(14) | 18.60 GBp (3.4%) | | Volume / 20-session average | 81,877,874 / 52,698,222 | | 20-session support / resistance | 552.20 / 638.50 GBp | | Three-month low / high | 512.70 / 638.54 GBp |Summary Data BP
| Last price | 552.20 GBp |
| Change 1 day / 5 days / 1 month | -0.81% / -6.30% / -9.48% |
| Trend / MA-cross | sideways / none |
| SMA20 / SMA50 | 602.01 / 577.86 |
| RSI (14) / Stochastic %K | 35.2 / 12.1 |
| Bollinger %B / ATR | 2% / 18.60 |
| Support / Resistance 20 days | 552.20 / 638.50 |
| Data as of | 11 November 2026 00:15 WIB |
| JournalArta research verdict (score) | Hold (-33) |
Today's full Buy and Sell list for UK, Singapore & Hong Kong stocks →
Disclaimer: This technical analysis is generated automatically from exchange data and indicators calculated by JournalArta, for information and education only. The verdict and the entry, target and stop-loss levels are not investment advice or a solicitation to buy or sell any security. Investment decisions and their risks rest solely with the reader.
Track BP share price daily: live levels, support/resistance and our full BP analysis history.