Hiscox Share Price Technicals: Rises 0.84% on Tuesday, Golden Cross Formed
Technical analysis of Hiscox stock on November 10, 2026: price 1,926.00 GBp, trend uptrend, RSI 57.4, support 1,811.00, resistance 1,990.00.

Hiscox Ltd shares rose 0.84% to 1,926.00 GBp on the London Stock Exchange on Tuesday, November 10, 2026, as a newly formed golden cross put the insurer’s improving price trend in focus. The signal is notable because the 20-day moving average has moved above the 50-day average, while rising On-Balance Volume suggests buying participation has strengthened; however, trading volume in the latest session was below its recent norm.
Why Hiscox is in focus today
- Fresh golden cross: SMA20 crossed above SMA50
- Not covered by JournalArta in the last 14 days
Selected automatically from 98 LSE (UK) stocks by a technical-signal score with daily weighted randomisation — not a recommendation.
Trend & Price Action
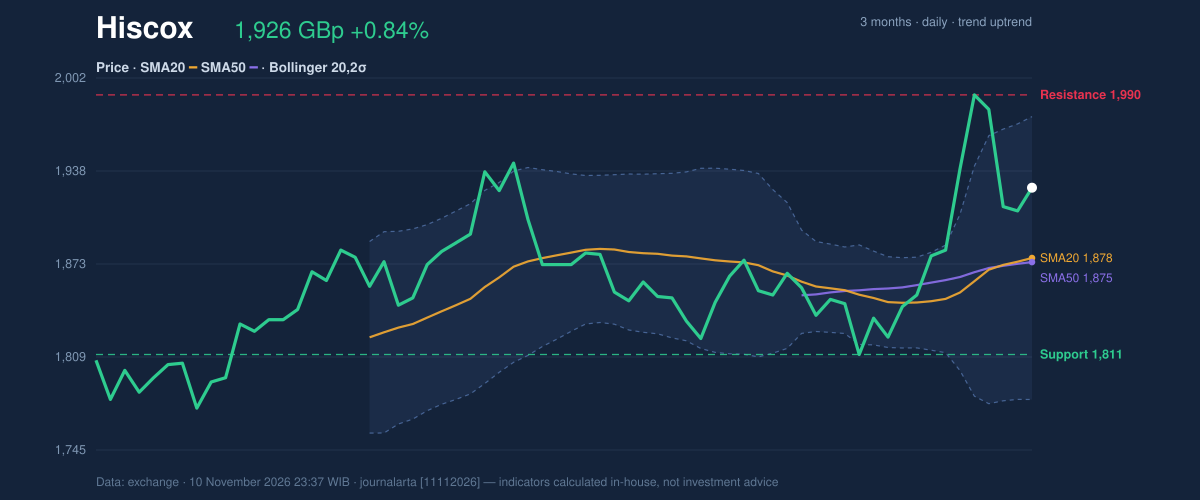
The shares gained 2.67% over one month but slipped 0.67% over five days, a short-term pause within a broader uptrend. Hiscox traded above both its SMA20 at 1,877.50 and SMA50 at 1,874.68, with the 20-day average rising 1.28% over five days. That rising average indicates the near-term trend has been building rather than simply holding flat.
The golden cross formed two sessions before the latest session, when the 20-day average crossed above the 50-day average. It is a trend signal, not proof that gains will continue: averages respond to past prices and can lag if the share price reverses. The latest price was at 64% of its 20-day range, between support at 1,811.00 and resistance at 1,990.00. The three-month high of 2,008.00 sits just above that resistance, making the area a significant test for the advance.
As shown in the chart, the share price remains above its moving averages and inside the Bollinger Bands, but is approaching the upper band.
Oscillators & Momentum
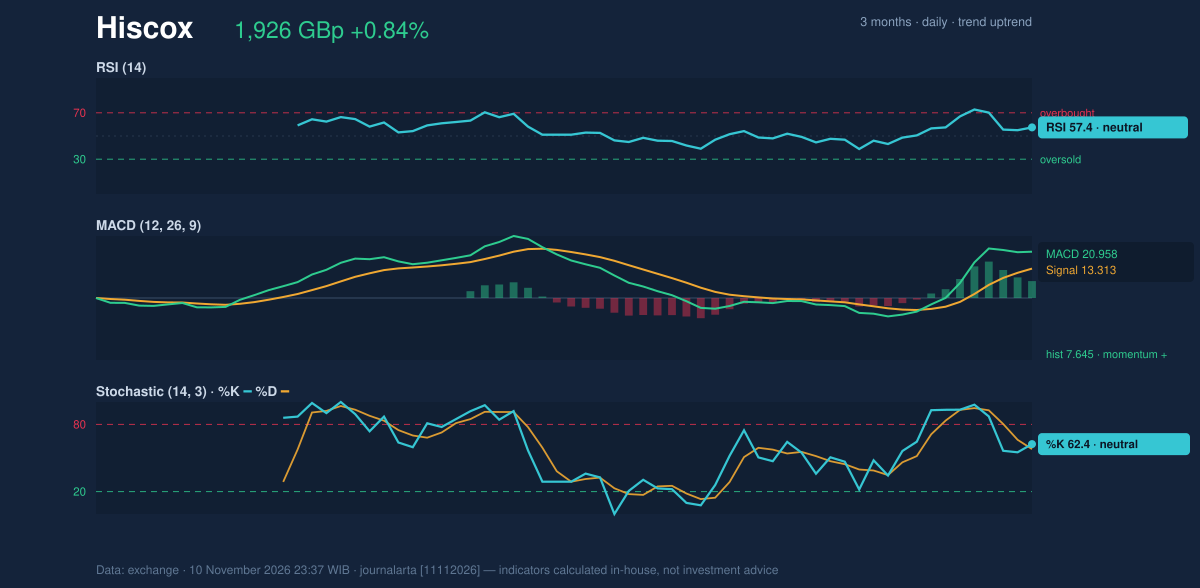
Momentum readings support, but do not overstate, the bullish trend. The RSI is neutral at 57.4, below the level associated with an overbought market, while the Stochastic is also neutral, with %K at 62.4 and %D at 58.0. These readings leave room for movement in either direction and show no strong evidence of a near-term extreme.
The MACD is positive: its reading of 20.958 is above the 13.313 signal line, and the histogram is positive at 7.645. That configuration indicates upward momentum is currently stronger than its recent baseline. A counter-signal is the RSI rolling over from above 65, one of the bearish technical signals recorded in the data; it points to cooling momentum, though the current RSI remains neutral rather than weak.
The chart shows the RSI, MACD and Stochastic readings together, highlighting the positive MACD against more moderate oscillator signals.
Volatility & Volume
The Bollinger Bands are at normal width, 10.4%, rather than showing a compressed setup that can precede a sharp expansion in movement. Hiscox’s price was at 75% of the band range, closer to the upper band at 1,975.06 than the lower band at 1,779.94. This places the shares in the upper half of their recent statistical range without, on its own, establishing that a breakout has occurred.
Average True Range, a measure of typical price movement, was 42.36, or 2.2% of the share price, indicating moderate volatility. Latest volume of 853,848 shares was 0.7 times the 20-day average of 1,162,377. That lighter turnover tempers the strength of the session’s gain, while rising OBV—a running measure that tracks volume alongside price direction—offers evidence that participation has improved over the broader trend.
Technical Verdict: BUY
BUY is the JournalArta Research technical verdict, supported by the uptrend, the 20-day average above the 50-day average after the golden cross, and rising OBV. The main caution is the RSI rolling over from above 65, alongside below-average latest-session volume. The verdict is invalidated if the price falls below 1,853.
- Ideal entry range: 1,895–1,926
- Exit targets: 2,035 (Target 1) and 2,145 (Target 2)
- Stop-loss protection: 1,853
- Validity period: through December 8, 2026
In plain English, the trend indicators currently lean upward, but the signal would weaken if the price falls through the stated protection level.
Summary Data Hiscox
| Last price | 1,926.00 GBp |
| Change 1 day / 5 days / 1 month | 0.84% / -0.67% / 2.67% |
| Trend / MA-cross | uptrend / golden |
| SMA20 / SMA50 | 1,877.50 / 1,874.68 |
| RSI (14) / Stochastic %K | 57.4 / 62.4 |
| Bollinger %B / ATR | 75% / 42.36 |
| Support / Resistance 20 days | 1,811.00 / 1,990.00 |
| Data as of | 10 November 2026 23:37 WIB |
| JournalArta research verdict (score) | Buy (+66) |
| Entry zone | 1,895 – 1,926 |
| Target 1 / 2 | 2,035 / 2,145 |
| Stop loss | 1,853 |
| Reward/risk | 1.5 / 3.0 |
Today's full Buy and Sell list for UK, Singapore & Hong Kong stocks →
Disclaimer: This technical analysis is generated automatically from exchange data and indicators calculated by JournalArta, for information and education only. The verdict and the entry, target and stop-loss levels are not investment advice or a solicitation to buy or sell any security. Investment decisions and their risks rest solely with the reader.
Track Hiscox share price daily: live levels, support/resistance and our full Hiscox analysis history.