International Airlines Share Price Analysis: Rises 1.33%, Testing Key Resistance
Technical analysis of IAG stock on November 10, 2026: price 456.70 GBp, trend sideways, RSI 65.6, support 394.70, resistance 456.70.

Why IAG is in focus today
- Volume at 1.6× the 20-day average
- Closed at a 20-day high (456.70)
- Trading near its 3-month high (461.70)
- Not covered by JournalArta in the last 14 days
Selected automatically from 98 LSE (UK) stocks by a technical-signal score with daily weighted randomisation — not a recommendation.
Trend & Price Action
The shares gained 9.44% over five days and 10.55% over one month. They ended above the 20-day moving average of 418.40 GBp, while that average rose 1.26% over five days. But the 20-day average remains below the 50-day average of 423.11 GBp, and there was no new moving-average crossover. That combination points to improving near-term momentum without a fully aligned trend signal. IAG closed at 100% of its 20-day range, at the 456.70 GBp resistance level, and just below its three-month high of 461.70 GBp. The close above the upper Bollinger Band at 448.72 GBp is a sign of forceful buying, though also means the price has moved beyond the band’s usual range. The chart shows the relationship between price, moving averages, Bollinger Bands and key levels.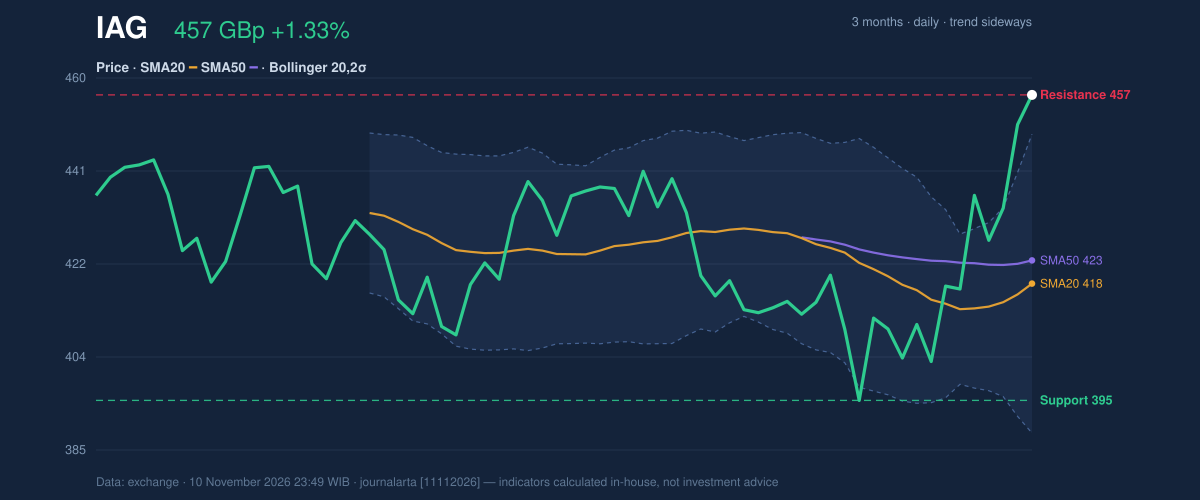
Oscillators & Momentum
Momentum indicators are positive but not unanimous. The MACD is positive at 5.335, with a 5.525 histogram, indicating that upward momentum is currently stronger than its signal line, which stands at -0.190. RSI is 65.6, in the neutral zone, so it is elevated but has not crossed into the stated overbought range. The Stochastic is overbought, with %K at 92.5 and %D at 87.7. That warns that the recent advance may be vulnerable to a pause or pullback, particularly as the price approaches its three-month high. It does not, on its own, establish that a reversal has started. The momentum chart displays RSI, MACD and Stochastic together.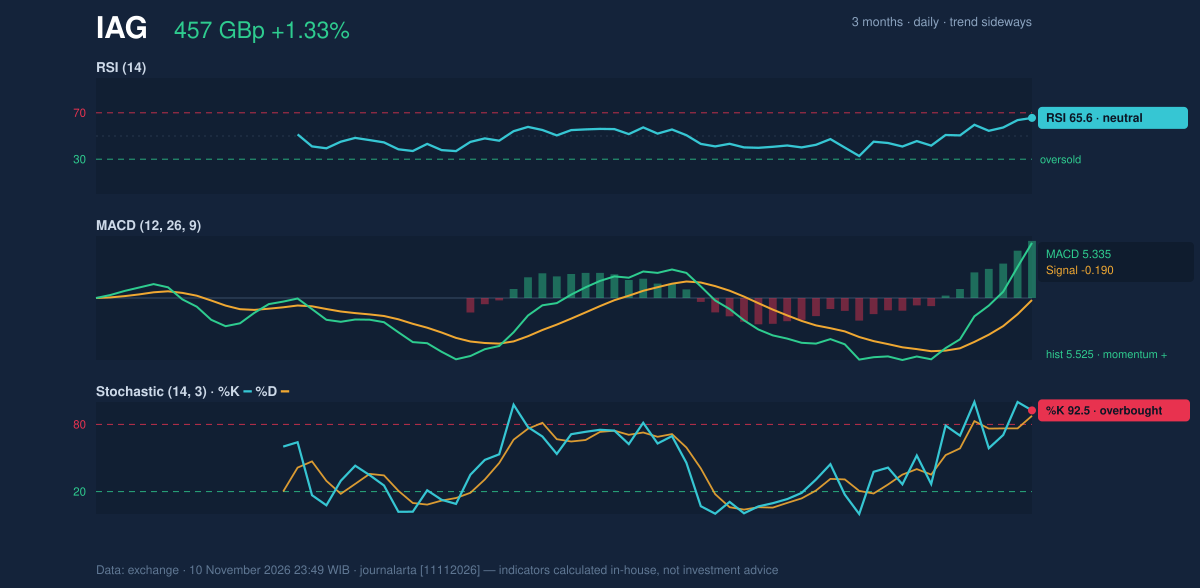
Volatility & Volume
Volume reached 18,933,636 shares, against a 20-day average of 11,836,540. That 1.6-times increase, alongside a rising OBV (a measure of whether volume is accumulating on up days), supports the view that buyers participated in the advance rather than the move occurring on thin activity. The Bollinger Band width is 14.5%, classified as normal, while the close above the upper band marks a squeeze resolution to the upside. In plain terms, the price has broken beyond the band’s upper boundary after a tighter phase, a bullish signal that can still be followed by volatility. ATR is 15.74 GBp, or 3.4% of the price, indicating moderate recent price swings rather than a low-volatility move.Key Levels & Scenarios
The immediate test is whether IAG can establish a close above 456.70 GBp, its 20-day resistance. The three-month high at 461.70 GBp is the next reference point in the supplied data. A close above resistance would confirm a further upside scenario; failure to hold the breakout area could leave the shares exposed to a retreat. The key downside reference is 394.70 GBp, the 20-day support and three-month low.Technical Verdict: HOLD (wait & see)
The JournalArta Research verdict is HOLD (wait & see). The strongest positive evidence is price above its 50-day average, a positive MACD and a high-volume advance; the caution is that the 20-day average remains below the 50-day average, while the Stochastic is overbought. The verdict is invalidated if price breaks below 394.70 GBp. - Ideal entry range: 456.70–461.70 GBp, conditional on a close above the 20-day resistance at 456.70 GBp. - Exit target: 480.30 GBp, the supplied price-plus-1.5-ATR reference. - Stop-loss protection: 394.70 GBp, the supplied 20-day support and three-month low. For non-traders, the HOLD verdict means the chart has encouraging buying signals, but not enough alignment to settle whether the breakout can persist. The close on Tuesday, November 10, was 456.70 GBp.Summary Data IAG
| Last price | 456.70 GBp |
| Change 1 day / 5 days / 1 month | 1.33% / 9.44% / 10.55% |
| Trend / MA-cross | sideways / none |
| SMA20 / SMA50 | 418.40 / 423.11 |
| RSI (14) / Stochastic %K | 65.6 / 92.5 |
| Bollinger %B / ATR | 113% / 15.74 |
| Support / Resistance 20 days | 394.70 / 456.70 |
| Data as of | 10 November 2026 23:49 WIB |
| JournalArta research verdict (score) | Hold (+41) |
Today's full Buy and Sell list for UK, Singapore & Hong Kong stocks →
Disclaimer: This technical analysis is generated automatically from exchange data and indicators calculated by JournalArta, for information and education only. The verdict and the entry, target and stop-loss levels are not investment advice or a solicitation to buy or sell any security. Investment decisions and their risks rest solely with the reader.
Track IAG share price daily: live levels, support/resistance and our full IAG analysis history.