Uber Stock Technicals: Rises 3.76% on Monday, Testing Key Resistance
Technical analysis of UBER stock on November 9, 2026: price 71.17 USD, trend sideways, RSI 58.3, support 65.25, resistance 71.32.

Uber Technologies shares jumped 3.76% to $71.17 in the New York session of Monday, November 9, 2026, lifting the five-day gain to 6.69% and pushing the stock to within a cent-level distance of its 20-day resistance at $71.32. The move was about 1.2 times the stock's average daily range, enough to put it on the watch list, yet the one-month change is still -0.46%. The rally has repaired a week of weakness without yet changing the larger picture.
Why UBER is in focus today
- One-day move of 3.76%, about 1.2× its average daily range (ATR)
- Not covered by JournalArta in the last 14 days
Selected automatically from 80 NYSE (US) stocks by a technical-signal score with daily weighted randomisation — not a recommendation.
Trend & Price Action
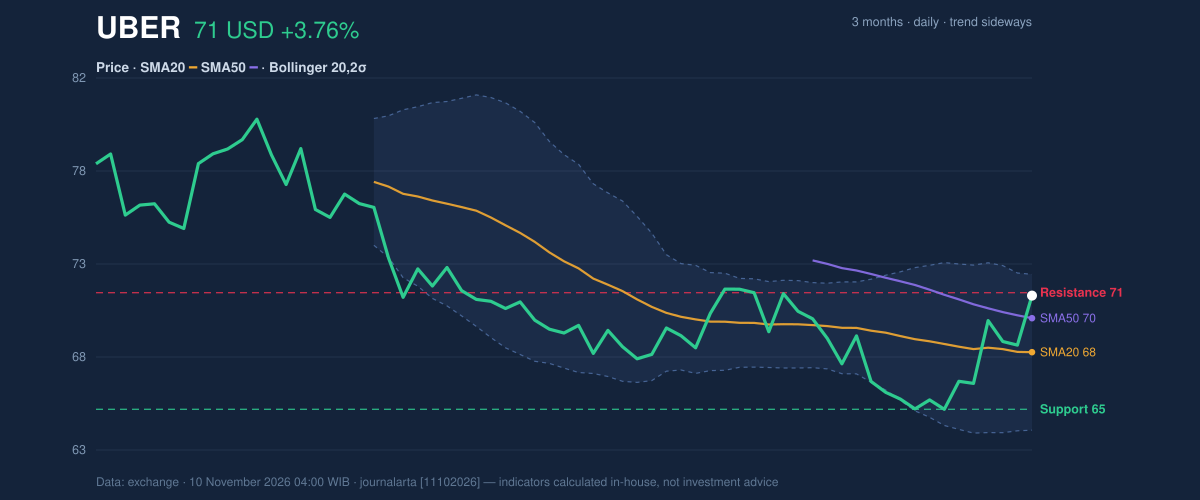
The trend reads sideways. The 20-day average rose by -0.42% over five days, which means it is still drifting slightly lower even as the price climbs above it. Price sits above the 20-day average at $68.22 and above the 50-day at $69.99, but the 20-day remains below the 50-day. No new moving-average cross has formed. In plain terms, the short-term bounce has outrun the slower averages, which have not yet turned to confirm it.
The stock now sits at 98% of its 20-day range, bounded by support at $65.25 and resistance at $71.32. The wider backdrop is less comfortable: the three-month high is $82.36, and the stock trades roughly $11 below it, while the three-month low of $64.04 is only about $1 beneath the 20-day support. As shown in the chart, price has pushed to the upper edge of a month-long consolidation.
Oscillators & Momentum
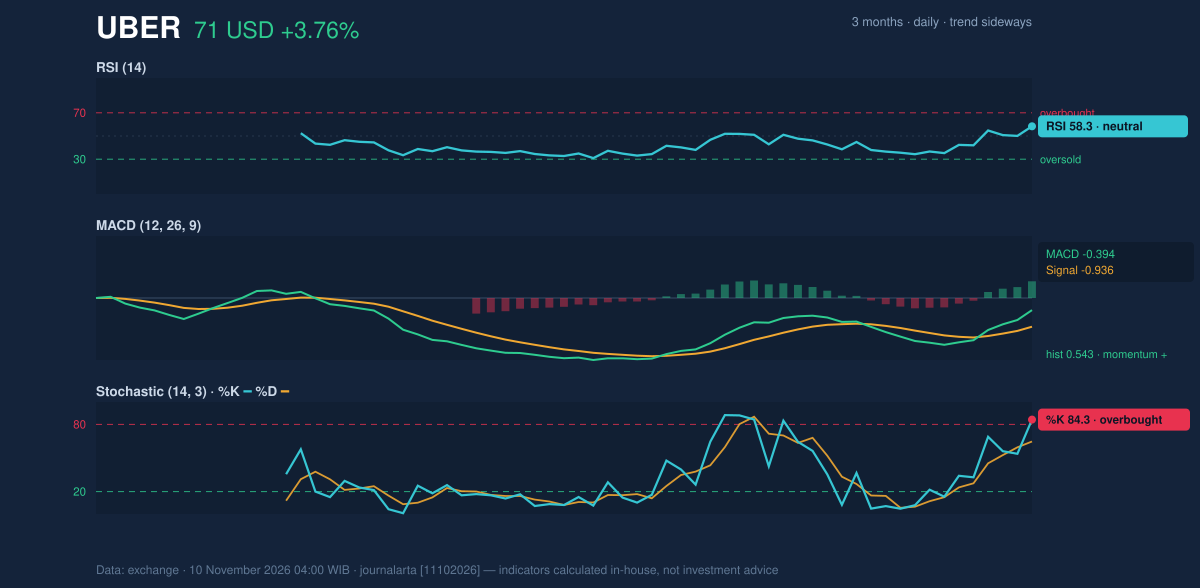
Momentum indicators disagree on how stretched the move is. The 14-day RSI, a gauge of recent buying strength on a 0-100 scale, is 58.3, neutral, with room before it reaches the 70 zone that usually signals an overheated market. The Stochastic oscillator, which measures where the close sits within its recent range, is more aggressive: %K at 84.3 against %D at 64.7, in overbought territory. The sharp gap between the two lines shows how fast the last session pulled it upward.
The MACD line is still negative at -0.394, below its signal line at -0.936, but the histogram is +0.543. That pattern means downward momentum has faded and the lines are converging, an early improvement rather than a completed turn. The momentum chart below shows that RSI has more room than the Stochastic.
Volatility & Volume
Bollinger Bands, which draw a channel two standard deviations around the 20-day average, run from $64.16 to $72.28. The stock's %B is 86%, meaning it sits in the upper part of the channel, and the band width of 11.9% is normal, so there is no squeeze or expansion pointing to an imminent breakout. The 14-day ATR of $2.14, or 3.0% of price, signals moderate volatility. A 1.5×ATR band around the last price gives $67.95 to $74.39, a rough guide to a plausible one- to two-session swing.
Participation is where the rally looks least convincing. Volume of 19,137,100 shares was 1.0 times the 20-day average of 19,058,620, so the rise came on ordinary rather than heavy trading. On-balance volume, which adds volume on up days and subtracts it on down days, is falling, a divergence suggesting that the recent selling has still carried more weight than the buying.
Fundamental Context
According to its SEC filing, Uber reported quarterly revenue of $14.77 billion for the quarter ended September 30, up 9.6% from $13.47 billion a year earlier (Form 10-Q filed November 4, 2026). Net income was $512.0 million, or $0.25 per diluted share, compared with $6.63 billion a year earlier. The same filing date also carried a Form 8-K covering results of operations and a change of directors or officers.
Key Levels & Scenarios
The immediate test is the 20-day resistance at $71.32, with the last price just below it. A daily close above that level would open the way toward the upper Bollinger band at $72.28 and the 1.5×ATR upper reference at $74.39. If the stock fails to hold, the first cushion is the 20-day average near $68.22, then the 1.5×ATR lower reference at $67.95, and finally the 20-day support at $65.25. A break under that level would bring the three-month low of $64.04 into view.
Technical Verdict: HOLD (wait & see)
JournalArta's research score is +20 on a scale running from -100 to +100, far from the +60 threshold for a positive call and the -60 threshold for a negative one. The call is HOLD (wait & see), because trend and momentum are not yet aligned. Three points drive it:
- Trend: price is above the 50-day average, but the 20-day average is still below it and sloping down.
- Momentum: RSI at 58.3 is neutral and the MACD histogram is positive, while the Stochastic at 84.3 is overbought.
- Participation: volume is only average and OBV is falling, so the bounce lacks confirmation.
The scenarios below are conditional, drawn only from the reference levels:
- Upside scenario, entry range: a daily close above $71.32.
- Upside scenario, exit target: $74.39 (price + 1.5×ATR), with $72.28 (upper Bollinger band) as an interim marker.
- Upside scenario, stop-loss level: $68.22 (20-day average) or, more conservatively, $67.95.
- Downside scenario, trigger: a break below the 20-day support at $65.25.
- Downside scenario, exit target: $64.04 (three-month low).
- Downside scenario, stop-loss level: a close back above $67.95.
The verdict is invalidated if price closes above $71.32 with rising volume, or breaks below $65.25. In plain terms, the chart is neither strong nor weak enough to call, so the sensible reading is to wait for a decisive move at either edge of the range.
Uber's 8-K filed November 4 reported a change of directors or officers alongside its results.
| Indicator | Value |
|---|---|
| Last price | $71.17 (prev close $68.59) |
| Change: 1 day / 5 days / 1 month | 3.76% / 6.69% / -0.46% |
| SMA20 / SMA50 | $68.22 / $69.99 |
| Bollinger (20, 2σ) | $72.28 / $68.22 / $64.16; %B 86% |
| RSI(14) | 58.3 (neutral) |
| Stochastic %K / %D | 84.3 / 64.7 (overbought) |
| MACD / signal / histogram | -0.394 / -0.936 / 0.543 |
| ATR(14) | $2.14 (3.0% of price) |
| Volume vs 20-day average | 19,137,100 vs 19,058,620 (1.0×) |
| 20-day support / resistance | $65.25 / $71.32 |
| 3-month high / low | $82.36 / $64.04 |
Summary Data UBER
| Last price | 71.17 USD |
| Change 1 day / 5 days / 1 month | 3.76% / 6.69% / -0.46% |
| Trend / MA-cross | sideways / none |
| SMA20 / SMA50 | 68.22 / 69.99 |
| RSI (14) / Stochastic %K | 58.3 / 84.3 |
| Bollinger %B / ATR | 86% / 2.14 |
| Support / Resistance 20 days | 65.25 / 71.32 |
| Data as of | 10 November 2026 04:00 WIB |
| JournalArta research verdict (score) | Hold (+20) |
Today's full Buy and Sell list for US stocks →
Disclaimer: This technical analysis is generated automatically from exchange data and indicators calculated by JournalArta, for information and education only. The verdict and the entry, target and stop-loss levels are not investment advice or a solicitation to buy or sell any security. Investment decisions and their risks rest solely with the reader.
Track UBER stock price daily: live levels, support/resistance and our full UBER analysis history.