Meta Platforms (META) Stock Analysis: Rises 5.12%, Death Cross Pressure
Technical analysis of META stock on November 9, 2026: price 641.37 USD, trend downtrend, RSI 46.4, support 605.08, resistance 762.50.

Meta Platforms shares jumped 5.12% to $641.37 in the Nasdaq session on Monday, November 9, 2026, a move roughly 1.3 times the stock's average daily range. The rebound still leaves the stock 13.67% lower over one month, and it arrived two sessions after a death cross, a chart pattern in which a short-term average slips below a longer-term one. Over five days the shares are up 5.71%.
Why META is in focus today
- One-day move of 5.12%, about 1.3× its average daily range (ATR)
- Fresh death cross: SMA20 crossed below SMA50
Selected automatically from 100 NASDAQ (US) stocks by a technical-signal score with daily weighted randomisation — not a recommendation.
Trend & Price Action
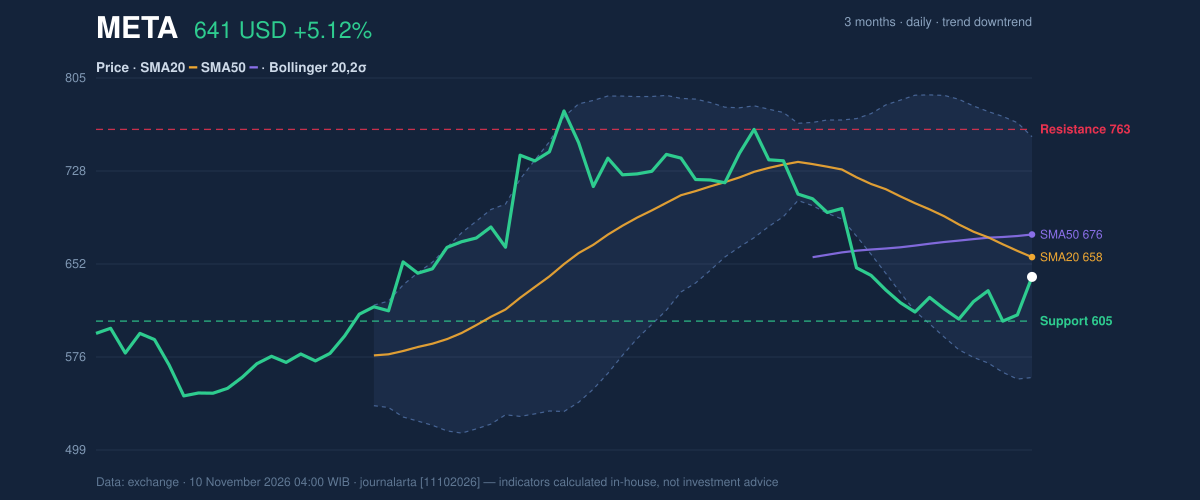
The bounce has not changed the structure of the chart. Meta closed below its 20-day average of 657.59 and below its 50-day average of 676.19. The 20-day average itself fell 3.91% over five days, a sign that recent selling has outweighed buying across the past month, not just the past week. The two averages crossed two sessions before the latest one, with the 20-day moving under the 50-day. That timing is recent but not brand new: the cross did not form on Monday.
A death cross is a lagging signal. It confirms that weakness has already built up rather than predicting a fresh leg down. Its weight here comes from the company it keeps: price sits under both averages, and Monday's rally stopped just short of the 20-day line, which now acts as the first ceiling. As shown in the chart, the stock sits at about 23% of its 20-day range, between a 20-day support of 605.08 and resistance of 762.50. The three-month range runs from a low of 537.27 to a high of 779.82.
Oscillators & Momentum
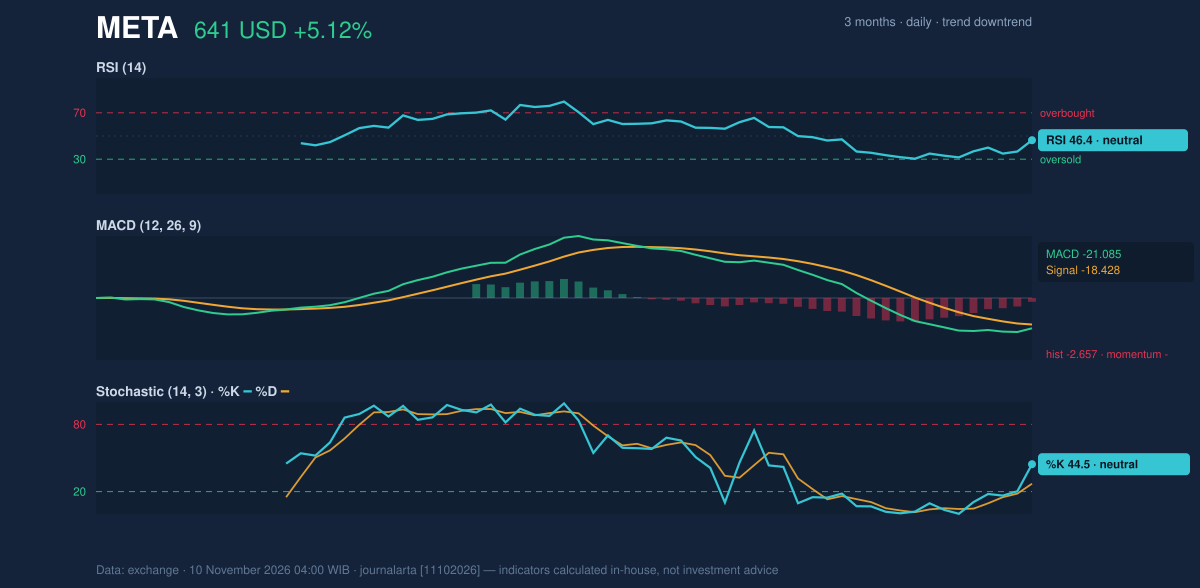
Momentum gauges show a market that has stopped falling in a straight line without turning decisively higher. The RSI(14) reads 46.4, neutral, meaning recent gains and losses are roughly balanced. The Stochastic %K of 44.5 sits above %D at 27.1, also neutral, but the gap shows short-term momentum has lifted off its lows. This is the one bullish technical signal in the computed set: RSI rebounding from below 35.
The MACD tells the other half of the story. At -21.085 against a signal line of -18.428, the histogram of -2.657 remains negative. MACD tracks the gap between fast and slow price averages, so a negative reading says the short-term trend still lags the longer one. A one-day pop does not erase that. The code-based count is one bullish signal against three bearish: the fresh death cross, a bounce into the 20-day average within a downtrend, and a downtrend confirmed by falling on-balance volume (OBV).
Volatility & Volume
Bollinger Bands, which draw a range two standard deviations around the 20-day average, are wide and widening: the upper band is 756.48, the lower 558.71, and band width is 30.1%. The price sits at 42% of the band (%B), near the middle. The ATR(14) of 24.74, or 3.9% of the price, means a typical day moves about $25. Wide bands and a high ATR suggest large swings in either direction remain normal, so levels need room to breathe.
Volume offers the clearest caution on the rally. Monday's turnover of 19.1 million shares was 0.8 times the 20-day average of 24.9 million. A 5% gain on below-average participation suggests buyers were not broadly committed. OBV, a running tally that adds volume on up days and subtracts it on down days, is still falling, which matches the weakness in the averages.
Fundamental Context
The selling has not come from a deteriorating business, at least not in the latest filing. According to its SEC Form 10-Q filed October 22, Meta reported quarterly revenue of $64.60 billion for the quarter ended September 30, up 26.1% from $51.24 billion a year earlier. Net income was $9.86 billion against $2.71 billion a year earlier, and diluted earnings per share were $3.83. The company also filed Form 8-Ks on October 29, reporting a material definitive agreement, and on November 5, reporting other material events; the filings summarized here do not detail them. The technical verdict below rests on price signals alone.
Technical Verdict: SELL
JournalArta's research model rates Meta SELL, with a score of -66 on a scale of -100 to +100 (a sell call begins at -60). The strongest reasons:
- Price below the 50-day average: 641.37 against 676.19, with the 20-day average also below the 50-day after the fresh death cross.
- Signal balance: one bullish signal (RSI rebound) against three bearish, including a bounce into the 20-day average within a downtrend.
- Volume confirmation of weakness: falling OBV and a rally on 0.8 times normal volume.
The levels computed for this call, valid until December 8, 2026:
- Entry range (sell zone): 641.37 – 659.93
- Exit target 1: 578.24 (reward/risk 1.5)
- Exit target 2: 515.10 (reward/risk 3.0)
- Stop loss: 683.46
The verdict is invalidated if the price closes above 683.46, which would put it back above the 50-day average at 676.19. In plain terms: Meta's chart still points down despite Monday's bounce, and the rally has yet to prove itself with strong buying. This is technical analysis, not an investment recommendation.
| Indicator | Value |
|---|---|
| Last price | 641.37 USD |
| Change (1 day / 5 days / 1 month) | 5.12% / 5.71% / -13.67% |
| SMA20 / SMA50 | 657.59 / 676.19 |
| Bollinger upper / middle / lower | 756.48 / 657.59 / 558.71 |
| RSI(14) | 46.4 |
| Stochastic %K / %D | 44.5 / 27.1 |
| MACD / signal / histogram | -21.085 / -18.428 / -2.657 |
| ATR(14) | 24.74 |
| Support / resistance (20 days) | 605.08 / 762.50 |
| 3-month low / high | 537.27 / 779.82 |
"We continue to see strong momentum across our family of apps," the company's quarterly filing cycle has typically framed its business, but the chart is asking whether investors still agree.
Summary Data META
| Last price | 641.37 USD |
| Change 1 day / 5 days / 1 month | 5.12% / 5.71% / -13.67% |
| Trend / MA-cross | downtrend / death |
| SMA20 / SMA50 | 657.59 / 676.19 |
| RSI (14) / Stochastic %K | 46.4 / 44.5 |
| Bollinger %B / ATR | 42% / 24.74 |
| Support / Resistance 20 days | 605.08 / 762.50 |
| Data as of | 10 November 2026 04:00 WIB |
| JournalArta research verdict (score) | Sell (-66) |
| Sell zone | 641.37 – 659.93 |
| Target 1 / 2 | 578.24 / 515.10 |
| Stop loss | 683.46 |
| Reward/risk | 1.5 / 3.0 |
Today's full Buy and Sell list for US stocks →
Disclaimer: This technical analysis is generated automatically from exchange data and indicators calculated by JournalArta, for information and education only. The verdict and the entry, target and stop-loss levels are not investment advice or a solicitation to buy or sell any security. Investment decisions and their risks rest solely with the reader.
Track META stock price daily: live levels, support/resistance and our full META analysis history.