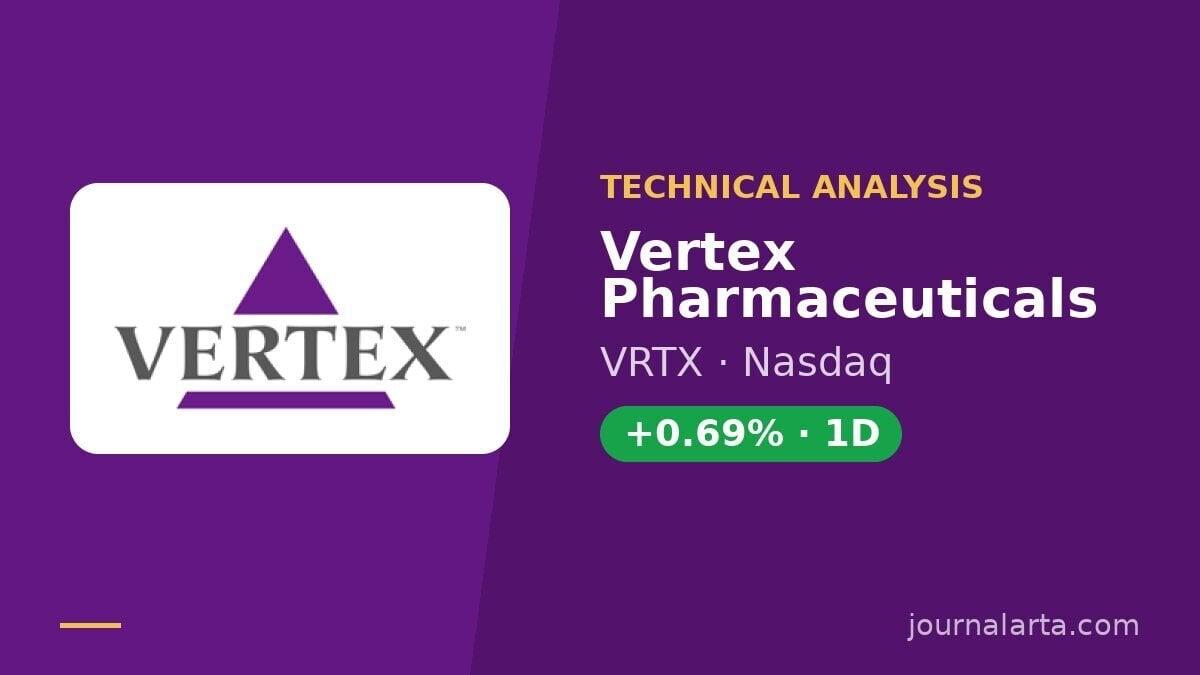
Vertex Pharmaceuticals (VRTX) Stock Rises 0.69% (November 9, 2026): Golden Cross Formed
Technical analysis of VRTX stock on November 9, 2026: price 550.87 USD, trend uptrend, RSI 59.2, support 485.22, resistance 558.88.
Why VRTX is in focus today
- Fresh golden cross: SMA20 crossed above SMA50
- Not covered by JournalArta in the last 14 days
Selected automatically from 100 NASDAQ (US) stocks by a technical-signal score with daily weighted randomisation — not a recommendation.
Trend & Price Action
The golden cross matters because it shows recent prices have been consistently higher than those of the past two months. The 20-day average sits at $526.65, above the 50-day average at $522.98. The gap between them is narrow, about $3.67, so the signal is young and could fade if the stock slips. The shares trade above both averages, and the 20-day average rose 1.86% over five days. That is the pace of the average itself, not of the share price, which slipped 0.41% over the same five sessions. In other words, the trend is still pointing up, but the last week has been a pause rather than a push. The stock sits at 89% of its 20-day range, between support at $485.22 and resistance at $558.88. The three-month high is $568.67 and the low is $484.08. Shares are within about $8 of the nearer ceiling, as the chart below shows.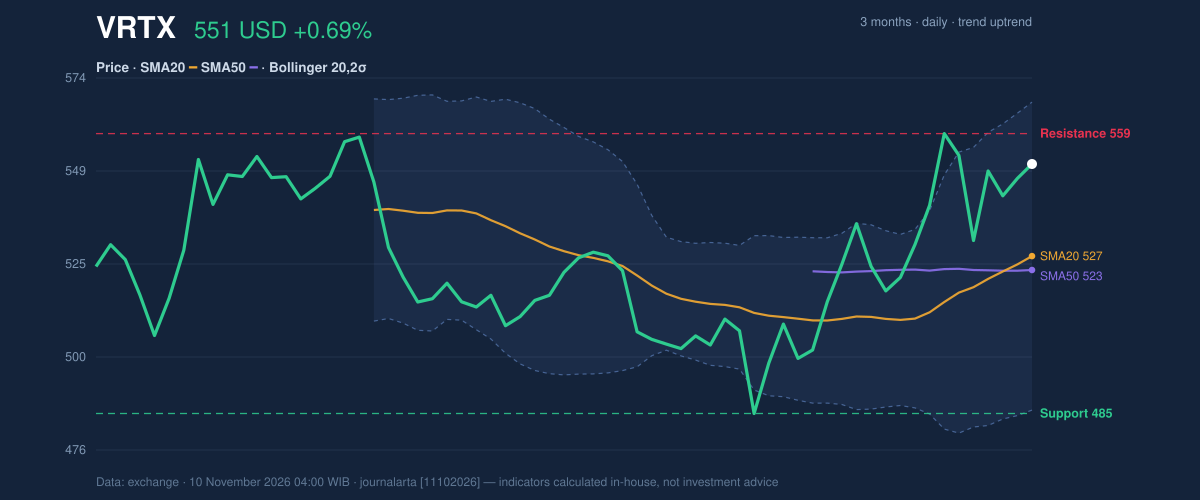
Oscillators & Momentum
Momentum indicators confirm the trend without flashing excess. The 14-day RSI, which compares recent gains with recent losses on a 0–100 scale, is 59.2, neutral and well short of the 70 level that usually signals a stretched rally. The Stochastic oscillator, which shows where the close sits within its recent range, reads 70.1 (%K) against 66.1 (%D), also neutral but near the upper end. The MACD line, which tracks the gap between short- and long-term averages, stands at 8.972 above its signal line at 6.360. The histogram of 2.612 is positive, meaning upward momentum is still building rather than fading. The three gauges point the same way, which gives the golden cross more credibility than it would have on its own.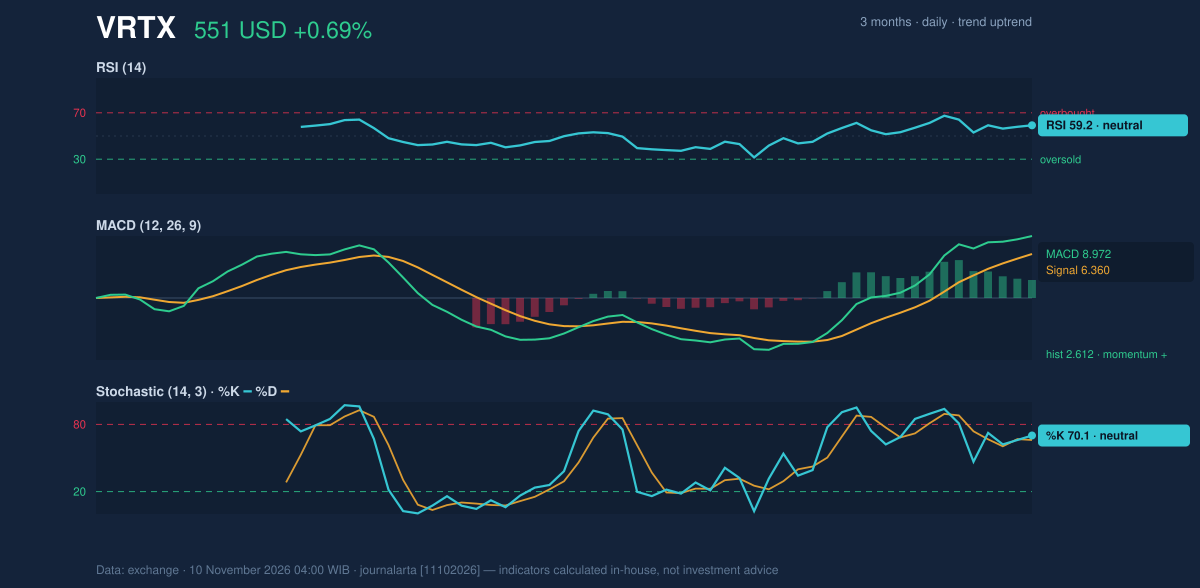
Volatility & Volume
The Bollinger Bands, which draw a range two standard deviations around the 20-day average, run from $486.13 to $567.17. The stock's %B reading of 80% puts it in the upper part of that channel, and the band width of 15.4% is normal, so there is no squeeze setting up a sudden break. The 14-day Average True Range of $19.65, or 3.6% of the price, is high. Daily swings of that size mean stop-loss levels need room, and a single session can move the stock several percent. Participation is mixed. Monday's volume of 1,213,400 shares was only 0.7 times the 20-day average of 1,692,120, so the latest advance was on thin trading. On-balance volume, which adds volume on up days and subtracts it on down days, is rising, suggesting buyers have been more active than sellers over the period. Light volume near resistance is the one soft spot in an otherwise supportive picture.Fundamental Context
According to its SEC filing, Vertex reported quarterly revenue of $3.44 billion for the quarter ended September 30, 2026, up 11.8% from $3.08 billion a year earlier (Form 10-Q filed November 3). Net income was $653.6 million, compared with $1.08 billion a year earlier, and diluted earnings per share were $2.56. Revenue growth and lower profit sit side by side, so the technical strength is not simply a reflection of higher earnings. The company also filed a Form 8-K with the U.S. Securities and Exchange Commission on November 2 covering its results of operations and financial condition.Key Levels & Scenarios
The immediate test is resistance at $558.88. A close above it would put the upper Bollinger Band at $567.17 and the three-month high of $568.67 in view. If the stock fails to hold, the 20-day average at $526.65 is the first cushion, followed by the 50-day average at $522.98. A break below the 20-day support at $485.22 would undo the recent rise.Technical Verdict: BUY
JournalArta's research model rates VRTX BUY with a score of +74 on a −100 to +100 scale, above the +60 threshold. Three bullish signals are active and none are bearish. The strongest reasons: - Fresh golden cross: the 20-day average moved above the 50-day average. - Pullback within an uptrend: price is above the 50-day average, with the MACD histogram positive at 2.612. - Volume support: rising on-balance volume confirms the uptrend, even though Monday's volume was light. The levels, valid until December 8, 2026: - Entry range: $536.13 – $550.87 - Exit target 1: $601.03 (reward/risk 1.5) - Exit target 2: $651.19 (reward/risk 3.0) - Stop loss: $517.43 The verdict is invalidated if the price falls below $517.43, which would also take it under both moving averages. Risks to weigh are the high 3.6% ATR and the below-average volume. In plain terms, the chart data currently favor the upside for Vertex, but a drop below $517.43 would mean that view was wrong. This is technical analysis based on market data, not an investment recommendation.Summary Data VRTX
| Last price | 550.87 USD |
| Change 1 day / 5 days / 1 month | 0.69% / -0.41% / 8.65% |
| Trend / MA-cross | uptrend / golden |
| SMA20 / SMA50 | 526.65 / 522.98 |
| RSI (14) / Stochastic %K | 59.2 / 70.1 |
| Bollinger %B / ATR | 80% / 19.65 |
| Support / Resistance 20 days | 485.22 / 558.88 |
| Data as of | 10 November 2026 04:00 WIB |
| JournalArta research verdict (score) | Buy (+74) |
| Entry zone | 536.13 – 550.87 |
| Target 1 / 2 | 601.03 / 651.19 |
| Stop loss | 517.43 |
| Reward/risk | 1.5 / 3.0 |
Today's full Buy and Sell list for US stocks →
Disclaimer: This technical analysis is generated automatically from exchange data and indicators calculated by JournalArta, for information and education only. The verdict and the entry, target and stop-loss levels are not investment advice or a solicitation to buy or sell any security. Investment decisions and their risks rest solely with the reader.
Track VRTX stock price daily: live levels, support/resistance and our full VRTX analysis history.