AstraZeneca Share Price Rises 0.98%, RSI Overbought In Focus
Technical analysis of AstraZeneca stock on November 9, 2026: price 14,066.00 GBp, trend uptrend, RSI 71.1, support 11,896.00, resistance 14,066.00.
Why AstraZeneca is in focus today
- Closed at a 20-day high (14,066.00)
- Trading near its 3-month high (14,312.00)
- RSI(14) at 71.1 — overbought zone
- Uptrend confirmed (5-day change 1.49%)
Selected automatically from 98 LSE (UK) stocks by a technical-signal score with daily weighted randomisation — not a recommendation.
Trend & Price Action
The structure is clean. Price sits above the 20-day simple moving average (SMA20) at 13,095.50, which in turn sits above the 50-day average (SMA50) at 12,518.04. A simple moving average is the mean closing price over a set number of sessions; when the shorter one holds above the longer one, it signals that recent buying has outpaced the medium-term trend. The data shows no new crossover between the two averages, so the uptrend is established rather than freshly triggered. The 20-day average itself rose 3.87% over five days. That is the slope of the average, not the share price, and it shows how quickly the underlying baseline has been lifted by recent trading. As shown in the chart, the close sits exactly at the top of the 20-day range: support at 11,896.00 and resistance at 14,066.00 put the price at 100% of its range. The 3-month range runs from a low of 11,404.00 to the high of 14,312.00, leaving the price about 246 pence below that ceiling.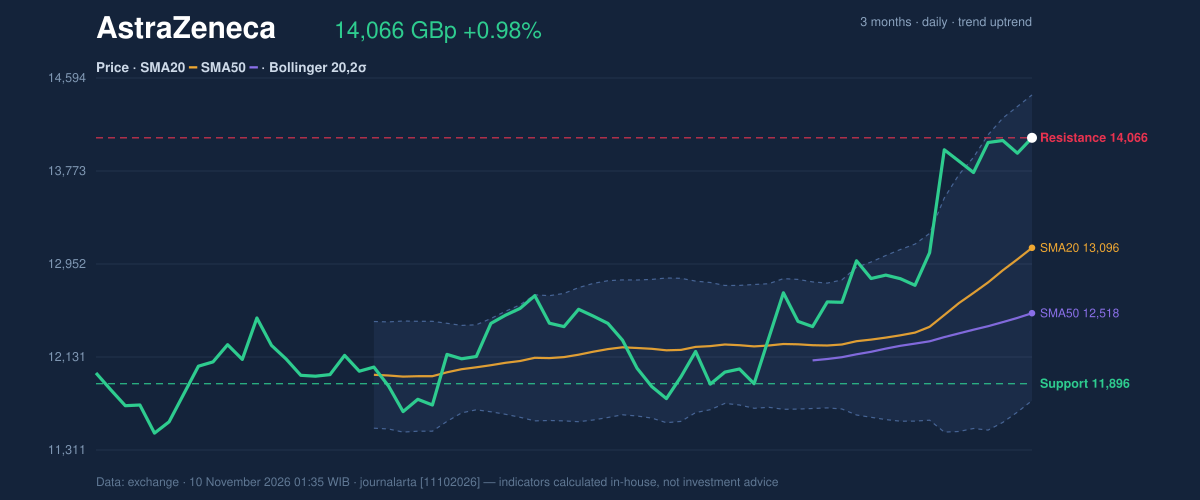
Oscillators & Momentum
Momentum indicators confirm the strength but also warn of its limits. The 14-day Relative Strength Index (RSI) stands at 71.1, above the conventional 70 line that marks overbought conditions. The Stochastic oscillator, which compares the close with the recent trading range, reads 86.3 (%K) and 84.3 (%D), also in overbought territory. Overbought does not mean a fall is due. In strong trends, these gauges can stay elevated for extended periods. What it does mean is that the easy part of the advance is behind the stock: the further price stretches from its averages, the more a pause or pullback tends to be needed to reset those readings. The MACD, a trend-following gauge built from two moving averages, supports the bullish side. The line is at 471.113 against a signal line of 367.425, a histogram of 103.688 and positive momentum. The gap between the MACD and its signal line is widening in favour of buyers, so momentum has not yet rolled over.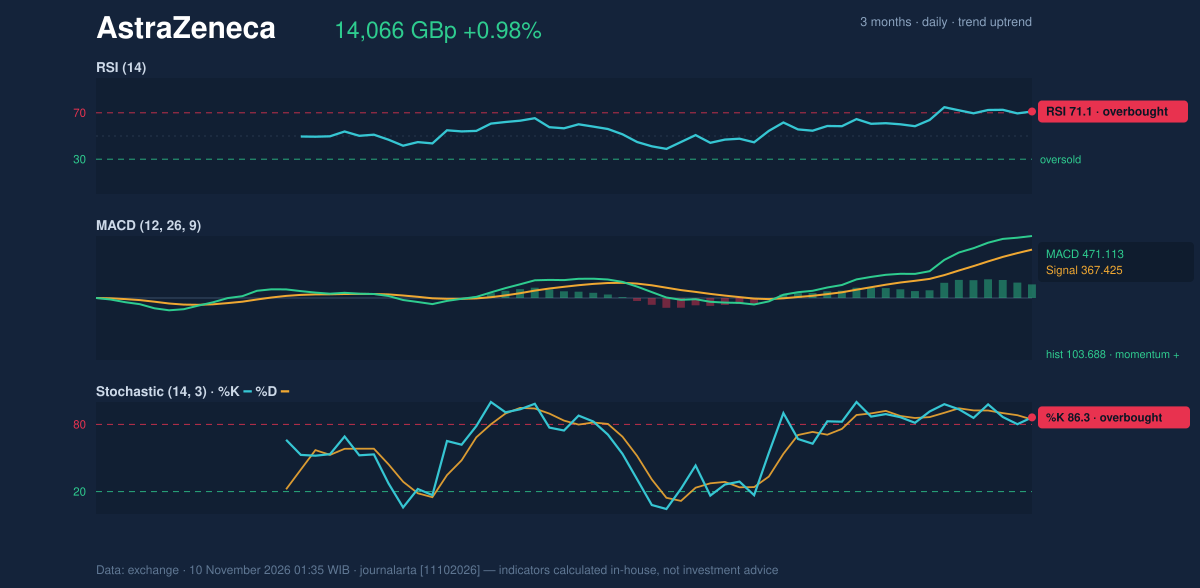
Volatility & Volume
The Bollinger Bands, which draw a channel two standard deviations around the 20-day average, have expanded to a width of 20.6%. The upper band is at 14,444.32, the middle at 13,095.50 and the lower at 11,746.68. Price sits at 86% of the band (%B), close to the upper edge. Wide bands signal high recent volatility, consistent with a stock that has gained nearly 17% in a month. The Average True Range (ATR), a measure of typical daily movement, is 364.71 pence, or 2.6% of the price, which the data classes as moderate volatility. That implies a normal daily swing of roughly a few hundred pence, a useful yardstick for judging whether any single day's move is unusual. Volume is the softer spot. Monday's turnover of 1,520,835 shares was only 0.6 times the 20-day average of 2,759,825, which the data labels thin. A new high on light trading means fewer participants backed the latest push. On the other side of the ledger, on-balance volume (OBV), which tallies volume on up days against down days, is rising, so accumulation over the broader period remains intact.Key Levels & Scenarios
The reference levels are straightforward. Above, the 20-day resistance at 14,066.00 is the current price itself, with the 3-month high of 14,312.00 and the upper Bollinger Band at 14,444.32 as the next markers. Below, the lower reference is the price minus 1.5 times ATR at 13,518.93, followed by the SMA20 at 13,095.50 and the 20-day support at 11,896.00. If the stock closes above 14,066.00 and then clears the 3-month high, the next reference sits at the price plus 1.5 times ATR, 14,613.07. If it fails to hold and slips, the first test is the 13,518.93 area, and a break of 11,896.00 would undo the month's advance.Technical Verdict: HOLD (wait & see)
The JournalArta research score is +58 on a scale of −100 to +100, just short of the +60 threshold for a buy call, so the verdict is HOLD (wait & see). The reasons: - Trend is strong: price above SMA50, SMA20 above SMA50, and a rising OBV. - Momentum is stretched: RSI 71.1 and Stochastic 86.3 are both overbought, so trend and momentum are not aligned yet. - Participation is thin: volume at 0.6 times its 20-day average on a breakout-type close. Conditional scenarios, drawn only from the reference levels: - Entry range (upside scenario): a daily close above 14,066.00, the 20-day resistance. - Exit target: 14,312.00, the 3-month high, with 14,613.07 (price + 1.5×ATR) as the extended reference. - Stop loss: 13,518.93 (price − 1.5×ATR); a break of the 20-day support at 11,896.00 is the downside scenario. The verdict is invalidated if price breaks below 11,896.00. In plain terms: the trend is up, but the stock looks stretched after a sharp rally, so the signals favour patience over chasing the move. This is technical analysis, not investment advice. AstraZeneca's 20-day support level is 11,896.00 pence, roughly 15.4% below Monday's close. | Indicator | Value | |---|---| | Last price | 14,066.00 GBp | | 1-day / 5-day / 1-month change | 0.98% / 1.49% / 16.96% | | SMA20 / SMA50 | 13,095.50 / 12,518.04 | | Bollinger (upper / middle / lower) | 14,444.32 / 13,095.50 / 11,746.68 | | RSI(14) | 71.1 | | Stochastic %K / %D | 86.3 / 84.3 | | MACD / signal / histogram | 471.113 / 367.425 / 103.688 | | ATR(14) | 364.71 | | 20-day support / resistance | 11,896.00 / 14,066.00 | | 3-month high / low | 14,312.00 / 11,404.00 |Summary Data AstraZeneca
| Last price | 14,066.00 GBp |
| Change 1 day / 5 days / 1 month | 0.98% / 1.49% / 16.96% |
| Trend / MA-cross | uptrend / none |
| SMA20 / SMA50 | 13,095.50 / 12,518.04 |
| RSI (14) / Stochastic %K | 71.1 / 86.3 |
| Bollinger %B / ATR | 86% / 364.71 |
| Support / Resistance 20 days | 11,896.00 / 14,066.00 |
| Data as of | 10 November 2026 01:35 WIB |
| JournalArta research verdict (score) | Hold (+58) |
Disclaimer: This technical analysis is generated automatically from exchange data and indicators calculated by JournalArta, for information and education only. The verdict and the entry, target and stop-loss levels are not investment advice or a solicitation to buy or sell any security. Investment decisions and their risks rest solely with the reader.
Track AstraZeneca share price daily: live levels, support/resistance and our full AstraZeneca analysis history.