Babcock International Share Price Technicals: Rises 4.77% on Monday, Golden Cross Formed
Technical analysis of Babcock stock on November 9, 2026: price 1,054.50 GBp, trend uptrend, RSI 63.7, support 887.20, resistance 1,054.50.

Why Babcock is in focus today
- One-day move of 4.77%, about 1.4× its average daily range (ATR)
- Closed at a 20-day high (1,054.50)
- Fresh golden cross: SMA20 crossed above SMA50
- Uptrend confirmed (5-day change 2.23%)
Selected automatically from 98 LSE (UK) stocks by a technical-signal score with daily weighted randomisation — not a recommendation.
Trend & Price Action
The trend is clearly up. The shares are above the 20-day average of 983.30, which sits above the 50-day average of 974.94. That ordering is what chartists call a golden cross: the faster average crosses above the slower one. It is read as a sign that recent buyers are paying more than the longer-term crowd did. The 20-day average rose 3.37% over five days, a measure of how quickly the trend is firming rather than of the share price itself. The price gains are uneven in size. The stock is up 2.23% over five days and 15.85% over one month. Much of the month's advance is therefore already in the books, and Monday's 4.77% jump added to it. Still, the shares are far from a clean break to new highs. The three-month range runs from a low of 871.20 to a high of 1,226.00, so the stock sits in the upper half of that band but well short of the ceiling.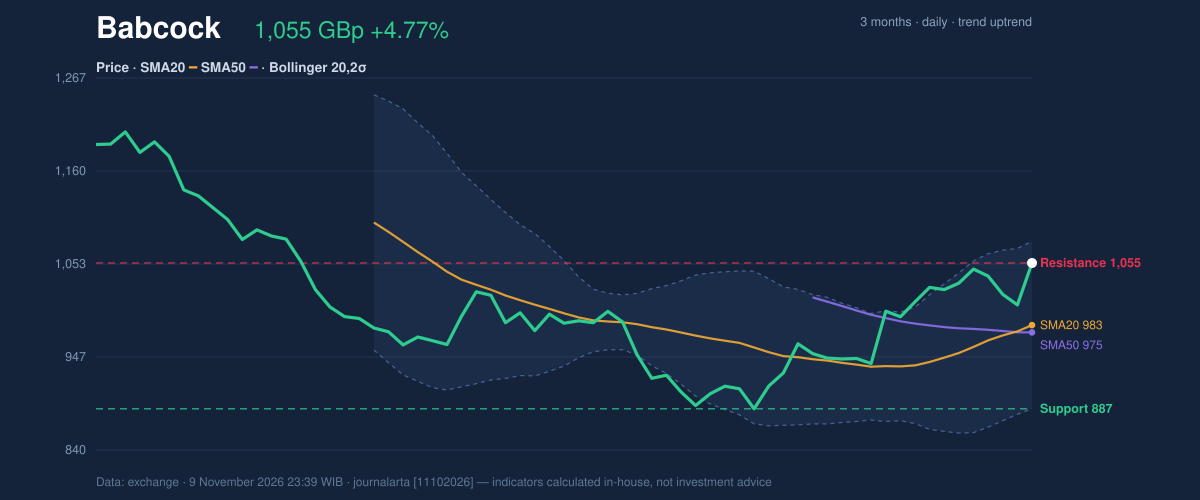
Oscillators & Momentum
Momentum indicators mostly agree with the trend, with one warning. The MACD line stands at 19.098 against a signal line of 10.963. The histogram, the gap between the two, is 8.135, a positive reading that shows upward momentum still building rather than fading. The RSI(14) is 63.7, in neutral territory. That matters: the RSI measures how strong recent gains are relative to recent losses, and a reading below 70 means the stock is not yet stretched by that gauge. The code-computed signal list does flag one bearish item, however, with the RSI rolling over from above 65. The Stochastic oscillator is hotter. Its %K reads 97.2 against a %D of 75.2, an overbought reading. In plain terms, the shares closed near the very top of their recent trading range. That often precedes a pause or a pullback, even inside a healthy uptrend.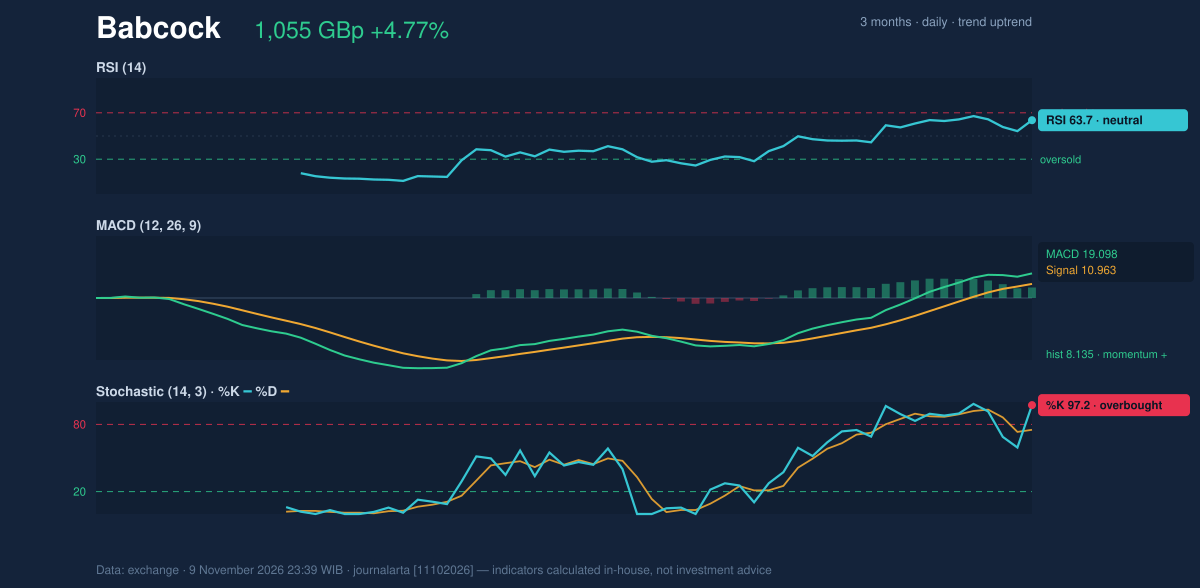
Volatility & Volume
Bollinger Bands, which draw a channel two standard deviations around the 20-day average, give a similar message. The upper band is 1,079.27, the middle 983.30 and the lower 887.32. The stock sits at 87% of the band (%B), close to the top. Band width is 19.5%, which the data classes as normal, so there is no squeeze signalling an imminent breakout. The 14-day ATR is 36.52, or 3.5% of the price, a moderate level of volatility. Practically, a daily swing of that size is ordinary for this stock and should not by itself be read as a reversal. Volume is the weak link. Monday's turnover was 760,544 shares against a 20-day average of 1,632,888, only 0.5 times normal. A rally on thin trading carries less conviction, because fewer investors have shown they are willing to transact at the higher price. On-balance volume, which tracks whether volume flows into rising or falling days, is also falling. That divergence is the main caveat to the price strength.Key Levels & Scenarios
The immediate marker is 1,054.50, where price now meets resistance. A sustained close above it would put the upper Bollinger Band at 1,079.27 in view. Beyond that lies the three-month high of 1,226.00. On the downside, the first cushion is the 20-day average near 983.30, followed by the 50-day average at 974.94. A slide through those levels would erase the golden cross's support. Below them, the 20-day support of 887.20 is the next marker.Technical Verdict: BUY
The JournalArta research score for Babcock is +60 on a scale of −100 to +100, which meets the threshold for a BUY call. The strongest reasons:- Moving averages: price is above its 50-day average, and the 20-day average has crossed above it in a fresh golden cross.
- Trend and momentum: the uptrend is intact, and the MACD histogram at 8.135 is positive.
- RSI: at 63.7 it sits in the 50–70 zone, which indicates strength without being overextended.
- Entry range: 1,028 – 1,054
- Exit target 1: 1,146
- Exit target 2: 1,238
- Stop loss: 992
- Reward/risk: 1.5 to target 1 and 3.0 to target 2
Summary Data Babcock
| Last price | 1,054.50 GBp |
| Change 1 day / 5 days / 1 month | 4.77% / 2.23% / 15.85% |
| Trend / MA-cross | uptrend / golden |
| SMA20 / SMA50 | 983.30 / 974.94 |
| RSI (14) / Stochastic %K | 63.7 / 97.2 |
| Bollinger %B / ATR | 87% / 36.52 |
| Support / Resistance 20 days | 887.20 / 1,054.50 |
| Data as of | 9 November 2026 23:39 WIB |
| JournalArta research verdict (score) | Buy (+60) |
| Entry zone | 1,028 – 1,054 |
| Target 1 / 2 | 1,146 / 1,238 |
| Stop loss | 992 |
| Reward/risk | 1.5 / 3.0 |
Disclaimer: This technical analysis is generated automatically from exchange data and indicators calculated by JournalArta, for information and education only. The verdict and the entry, target and stop-loss levels are not investment advice or a solicitation to buy or sell any security. Investment decisions and their risks rest solely with the reader.
Track Babcock share price daily: live levels, support/resistance and our full Babcock analysis history.