Home Depot (HD) Stock Technicals: Falls 1.85% on Friday, Golden Cross Formed
Technical analysis of HD stock on November 6, 2026: price 343.47 USD, trend uptrend, RSI 63.9, support 290.62, resistance 355.44.
By Alistair Sterling
November 9, 20265 min read
Advertisement
Logo Home Depot — JournalArta illustration
Why HD is in focus today
Fresh golden cross: SMA20 crossed above SMA50
Uptrend confirmed (5-day change 4.33%)
Selected automatically from 80 NYSE (US) stocks by a technical-signal score with daily weighted randomisation — not a recommendation.
Home Depot shares closed at $343.47 on the New York Stock Exchange on Friday, November 6, 2026, down 1.85% from the previous close of $349.94, according to exchange data. The pullback comes after a strong run: the stock is up 4.33% over five days and 18.14% over one month. A fresh golden cross adds to the picture. The 20-day average crossed above the 50-day average four sessions before the latest session, which is why the stock is on the watchlist today.
A golden cross means the shorter-term average of closing prices has moved above the longer-term one. Traders read it as a sign that recent buyers are paying more than the longer-term crowd paid. It is a trend signal, not a forecast, and it can fail.
Advertisement
Trend & Price Action
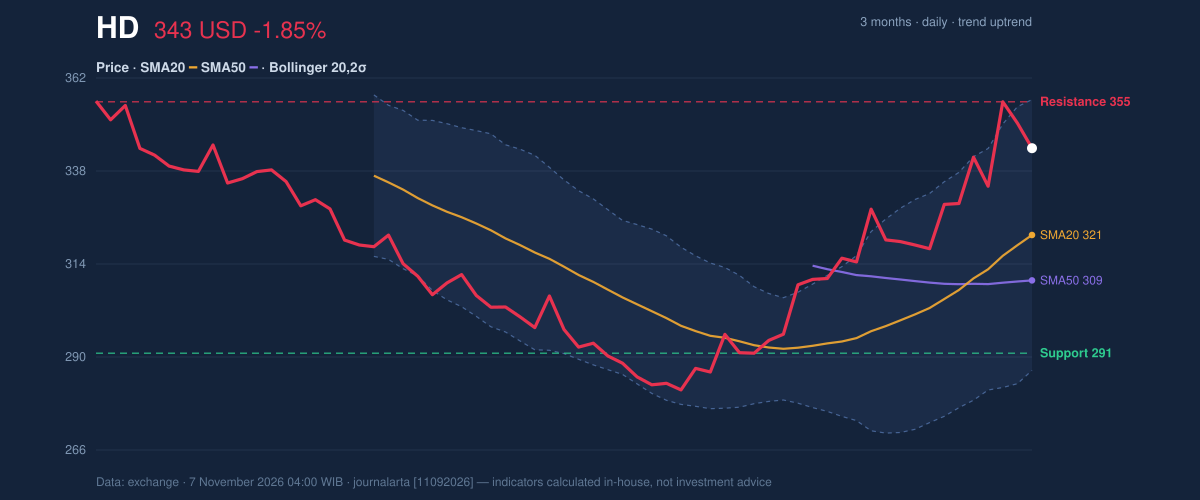
The trend is up. Price sits above the 20-day average at $321.09, which in turn sits above the 50-day average at $309.39. The 20-day average rose 4.62% over five days, so the structure is still building rather than flattening.
3-month price action chart of HD: price, SMA20/50, Bollinger, support & resistance.
As shown in the chart, the stock trades at 82% of its 20-day range. The range runs from support at $290.62 to resistance at $355.44. The three-month high is $362.44 and the three-month low is $277.15. Price is therefore about $12 below the 20-day ceiling, and the 18% monthly gain has left it stretched above both averages.
Stretched does not mean broken. It means the next move has less cushion beneath it.
Oscillators & Momentum
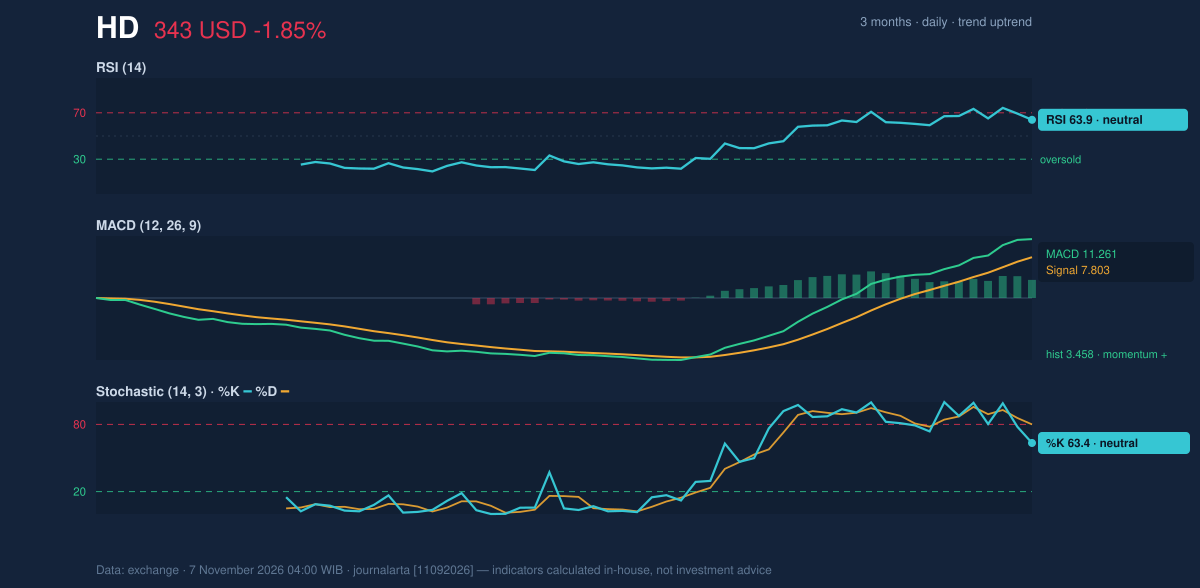
Momentum indicators are mostly supportive but show early fatigue. The RSI(14) is 63.9, in neutral territory. RSI measures how strong recent gains are relative to recent losses, and readings above 70 usually signal an overheated move. Code-computed signals note it is rolling over from above 65, a sign buying pressure is cooling.
The Stochastic %K of 63.4 sits below %D at 80.0. The Stochastic compares the closing price with its recent high-low range. A fast line dropping beneath its slow line is an early sign of weakening short-term momentum.
Momentum chart of HD: RSI(14), MACD, Stochastic.
Advertisement
The MACD tells a steadier story. At 11.261, it is above its signal line at 7.803, leaving a histogram of 3.458. MACD tracks the gap between fast and slow averages, and a positive, wide histogram means the trend's engine is still running. The mismatch is notable: the slower indicator says momentum is positive, while the faster ones say it is cooling.
Volatility & Volume
The Bollinger Bands, which draw a channel two standard deviations around the 20-day average, are widening. Band width is 21.7%, with the upper band at $356.01 and the lower at $286.18. The %B reading of 82% puts price in the upper part of the channel, close to the upper band and to the $355.44 resistance level. The two ceilings sit within a dollar of each other, which makes that zone a meaningful test.
The Average True Range (ATR), a measure of typical daily swing, is 10.08, or 2.9% of the price. That is moderate volatility. A 1.5×ATR band around the price spans $328.35 to $358.59.
Volume adds a caution. Friday's 5,519,200 shares were 1.2 times the 20-day average of 4,770,970, and heavier trading on a down day suggests sellers were active. On-balance volume (OBV), a running tally of volume flowing into or out of the stock, is falling even as price rises. That divergence suggests the rally has less participation than the price alone implies.
Advertisement
Fundamental Context
According to its SEC filing, Home Depot reported quarterly revenue of $47.86 billion for the quarter ended August 2, 2026, up 5.7% from $45.28 billion a year earlier (Form 10-Q filed August 25). Net income was $4.77 billion, compared with $4.55 billion a year earlier, and diluted earnings per share were $4.79. The numbers describe steady growth and do not by themselves explain the recent price surge.
Key Levels & Scenarios
If price pushes through $355.44 and then the three-month high of $362.44, the move would be confirmed by a fresh breakout. If it fails there, the first cushions are the 20-day average at $321.09 and the 50-day average at $309.39. Below those, the 20-day support is $290.62.
Technical Verdict: HOLD (wait & see)
The code-computed bias is neutral, with one bullish signal (the golden cross) against one bearish signal (RSI rolling over). The verdict is HOLD (wait & see) for three reasons:
Trend vs. participation: the golden cross and rising 20-day average support the uptrend, but OBV is falling while price rises.
Momentum is mixed: MACD histogram is positive at 3.458, while Stochastic %K (63.4) has slipped below %D (80.0).
Price is near a ceiling: %B is 82% and price is close to the $355.44 resistance and $356.01 upper band.
Advertisement
Reference levels derived strictly from the data:
Ideal entry range: $321.09 (20-day average) to $328.35 (price minus 1.5×ATR), a pullback zone nearer to support.
Exit target: $355.44 (20-day resistance), then $362.44 (three-month high) on a confirmed breakout.
Stop loss: below $309.39 (50-day average).
The verdict is invalidated if price falls below $309.39, which would break the support that defines the golden-cross structure.
In plain terms: the trend is healthy, but the stock looks stretched and the signals disagree, so the technical picture favors waiting for a pullback or a clean breakout rather than acting now.
Summary Data HD
Last price
343.47 USD
Change 1 day / 5 days / 1 month
-1.85% / 4.33% / 18.14%
Trend / MA-cross
uptrend / golden
SMA20 / SMA50
321.09 / 309.39
RSI (14) / Stochastic %K
63.9 / 63.4
Bollinger %B / ATR
82% / 10.08
Support / Resistance 20 days
290.62 / 355.44
Data as of
7 November 2026 04:00 WIB
Disclaimer: This technical analysis is generated automatically from exchange data and indicators calculated by JournalArta, for information and education only. The verdict and the entry, target and stop-loss levels are not investment advice or a solicitation to buy or sell any security. Investment decisions and their risks rest solely with the reader.