Abbott Laboratories (ABT) Stock Technicals: Falls 3.23% on Friday, Golden Cross Formed
Technical analysis of ABT stock on November 6, 2026: price 109.93 USD, trend uptrend, RSI 58.5, support 100.51, resistance 115.51.

Abbott Laboratories (ABT) fell 3.23% to $109.93 on Friday, November 6, 2026, yet a fresh golden cross and a month-long climb still frame the technical picture for the medical-devices maker. For global investors, the question is whether this is a pause in an uptrend or the start of a reversal. It looks like a pause. The stock reached the screen on three signals: a golden cross, a confirmed uptrend, and no coverage here in the past 14 days.
Why ABT is in focus today
- Fresh golden cross: SMA20 crossed above SMA50
- Uptrend confirmed (5-day change 3.51%)
- Not covered by JournalArta in the last 14 days
Selected automatically from 80 NYSE (US) stocks by a technical-signal score with daily weighted randomisation — not a recommendation.
Trend & Price Action
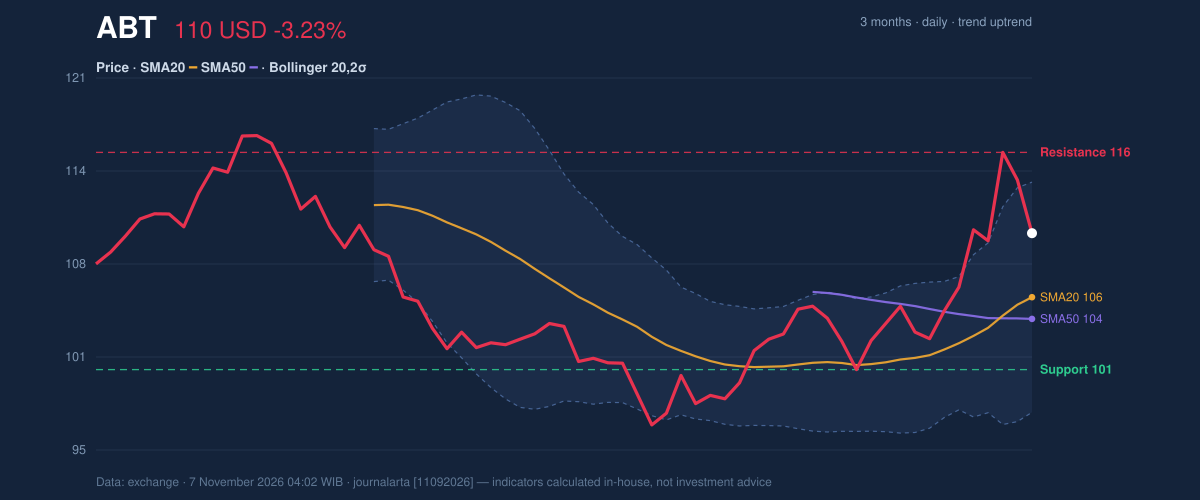
The one-day drop is the headline, but the wider frame is firmer. ABT is up 3.51% over five days and 10.37% over one month. The price sits above the 20-day simple moving average (SMA20) at 105.51, which in turn sits above the 50-day (SMA50) at 104.01.
That ordering matters. The golden cross, in which the faster average crosses above the slower one, formed two sessions before the latest session. It is not new today. The 20-day average rose 3.10% over five days, so the slope is still pointing up. Even after Friday's slide, the stock closed about 4.2 points above its short-term average, which is what an orderly pullback in an uptrend looks like.
The three-month range runs from a low of 95.06 to a high of 117.34. At 109.93, the price sits at 63% of its 20-day range, comfortably between support and resistance, as the chart below shows.
Oscillators & Momentum
Momentum indicators measure how strongly a price is moving, not just where it is. They are mixed here, and the mix is informative.
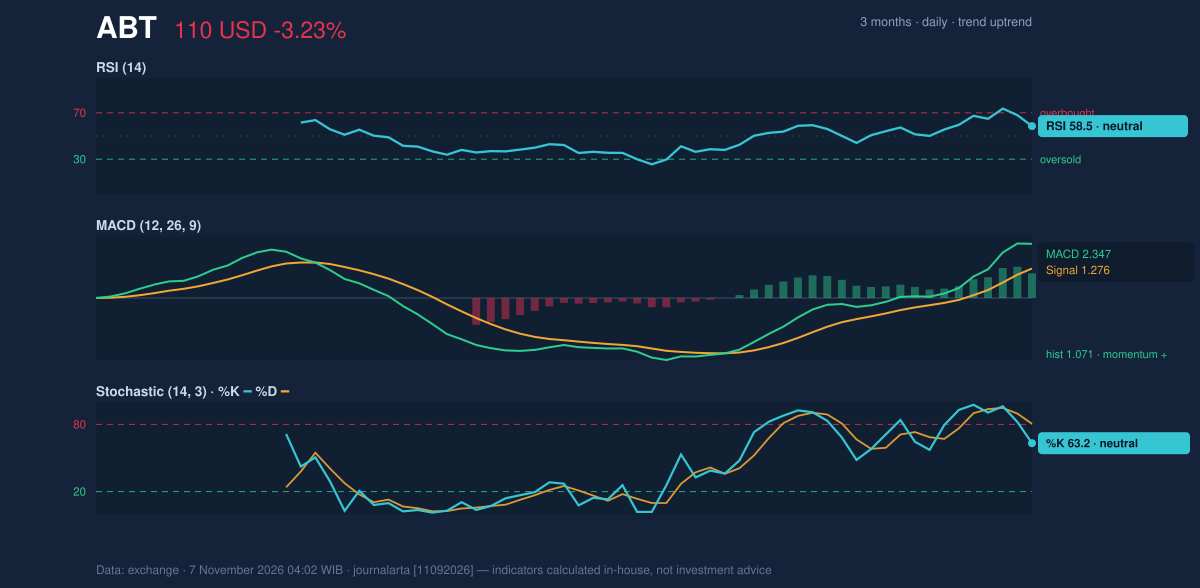
The RSI(14) reads 58.5, in neutral territory. Readings above 70 are usually read as overheated, so there is room before the stock looks stretched. The Stochastic %K of 63.2 sits below %D at 80.5. Because %K is the faster line, this shows short-term buying pressure cooling after a hot run. It matches Friday's decline.
The MACD is 2.347 against a signal line of 1.276, a histogram of 1.071. That gap means trend momentum remains positive despite the pullback. The code-computed bias flags one bearish signal, RSI rolling over from above 65, against three bullish ones. The oscillators are cooling inside an intact trend rather than reversing it.
Volatility & Volume
Bollinger Bands, which draw a volatility envelope around the 20-day average, span 97.56 to 113.46, with the midline at 105.51. Band width is 15.1%, a normal reading, and %B of 78% places the price in the upper part of the band, though not at the ceiling. The ATR(14) of 3.71, or 3.4% of the price, points to moderate volatility. In practical terms, daily swings of a few dollars are routine for this stock.
Volume offers a measured note. Friday's turnover was 8,345,100 shares, 0.9 times the 20-day average of 9,702,850. A sell-off on lighter-than-usual volume suggests less conviction behind the selling. On-balance volume (OBV), which tracks cumulative buying and selling pressure, is rising, which supports the uptrend.
Fundamental Context
According to its SEC filing (Form 10-Q, filed 2026-11-04), Abbott reported quarterly revenue of $13.01 billion for the quarter ended September 30, up 14.5% from $11.37 billion a year earlier. Net income was $920.0 million, against $1.64 billion in the same quarter a year earlier, with diluted earnings per share of $0.53. Strong sales alongside lower profit is a mixed picture, and it may help explain why the shares gave back ground after a strong month.
Key Levels & Scenarios
Resistance sits at 115.51 over 20 days, with the three-month high at 117.34. Support is at 100.51, with the SMA20 at 105.51 and the SMA50 at 104.01 acting as nearer cushions. A move through 115.51 would put the three-month high in view. A slip below the moving averages would raise the odds that the pullback is deeper than it looks.
Technical Verdict: BUY
The indicators support a BUY reading, in line with the code-computed bullish bias. The strongest reasons:
- Golden cross: SMA20 crossed above SMA50 two sessions before the latest session, with the 20-day average still rising.
- MACD: the 2.347 line above its 1.276 signal shows positive momentum.
- OBV rising: volume flow confirms the trend, and Friday's decline came on below-average turnover.
The verdict is invalidated if the price closes below the 20-day support at 100.51.
- Ideal entry range: 105.51 (SMA20) to 109.93 (last price)
- Exit target: 115.51 (20-day resistance)
- Stop loss: below 104.36 (price minus 1.5×ATR), with a hard line under 100.51
In plain terms, the chart suggests Abbott's rally is catching its breath rather than ending, and the signals lean toward further gains as long as the stock holds above about 100.51. This is technical analysis, not an investment recommendation.
Summary Data ABT
| Last price | 109.93 USD |
| Change 1 day / 5 days / 1 month | -3.23% / 3.51% / 10.37% |
| Trend / MA-cross | uptrend / golden |
| SMA20 / SMA50 | 105.51 / 104.01 |
| RSI (14) / Stochastic %K | 58.5 / 63.2 |
| Bollinger %B / ATR | 78% / 3.71 |
| Support / Resistance 20 days | 100.51 / 115.51 |
| Data as of | 7 November 2026 04:02 WIB |
Disclaimer: This technical analysis is generated automatically from exchange data and indicators calculated by JournalArta, for information and education only. The verdict and the entry, target and stop-loss levels are not investment advice or a solicitation to buy or sell any security. Investment decisions and their risks rest solely with the reader.
Track ABT stock price daily: live levels, support/resistance and our full ABT analysis history.