Airbnb (ABNB) Stock Rises 11.67%, Golden Cross Formed In Focus
Technical analysis of ABNB stock on November 6, 2026: price 189.99 USD, trend uptrend, RSI 66.1, support 163.50, resistance 189.99.

For investors watching U.S. travel and consumer-tech stocks, Airbnb delivered the biggest single-session move in the group on Friday, November 6, 2026. ABNB closed at $189.99, up 11.67% from a prior close of $170.13, on volume of 12,748,100 shares, about 2.9 times its 20-day average of 4,329,920. The stock is up 15.57% over five days and 14.54% over one month.
Why ABNB is in focus today
- One-day move of 11.67%, about 3.3× its average daily range (ATR)
- Volume at 2.9× the 20-day average
- Trading near its 3-month high (193.45)
- Fresh golden cross: SMA20 crossed above SMA50
- Uptrend confirmed (5-day change 15.57%)
Selected automatically from 100 NASDAQ (US) stocks by a technical-signal score with daily weighted randomisation — not a recommendation.
The move is about 3.3 times the stock's typical daily range, which is why it stands out in today's screen.
Trend & Price Action
The trend is up, and the structure has changed. The price sits above the 20-day simple moving average (SMA20) at 171.46, which itself is above the 50-day average (SMA50) at 169.07. A golden cross formed two sessions before the latest session, meaning the short-term average crossed above the longer one. Traders read that as a sign that recent buying is outweighing the past two months of trading. The 20-day average rose 1.79% over five days, a gentle slope compared with the sharp jump in price.
That gap matters. The price has run well ahead of the averages, so they have yet to catch up.
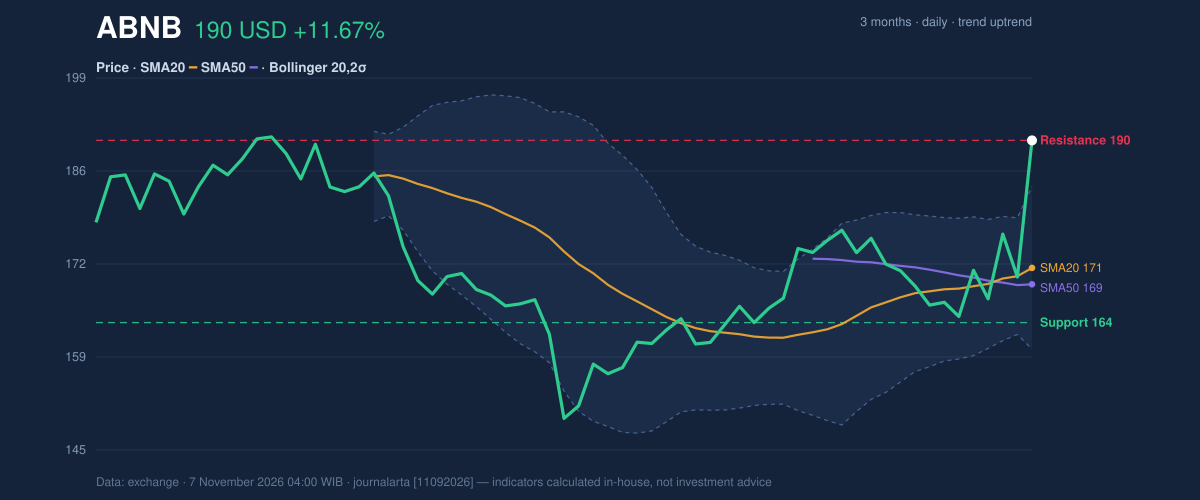
As shown in the chart, the close landed exactly on the 20-day high of 189.99, with the 3-month high of 193.45 only about 1.8% away. The 3-month low is 149.00. The stock therefore sits at 100% of its 20-day range, where buyers have driven price to the top of recent trading with no pullback to test support.
Oscillators & Momentum
Momentum indicators agree with the trend but show how stretched the move has become. The Relative Strength Index (RSI), which scores recent gains against losses on a 0–100 scale, reads 66.1, still neutral. It has room before the 70 mark that is commonly seen as overheated. The Stochastic oscillator, which shows where the close sits within its recent range, is hotter: %K at 91.2 against %D at 68.6, in overbought territory.
The MACD, which tracks the gap between short and long moving averages, reads 2.232 against a signal line of 0.879. The histogram of 1.352 shows positive momentum, and the code-based bias flags that it has only just turned positive.
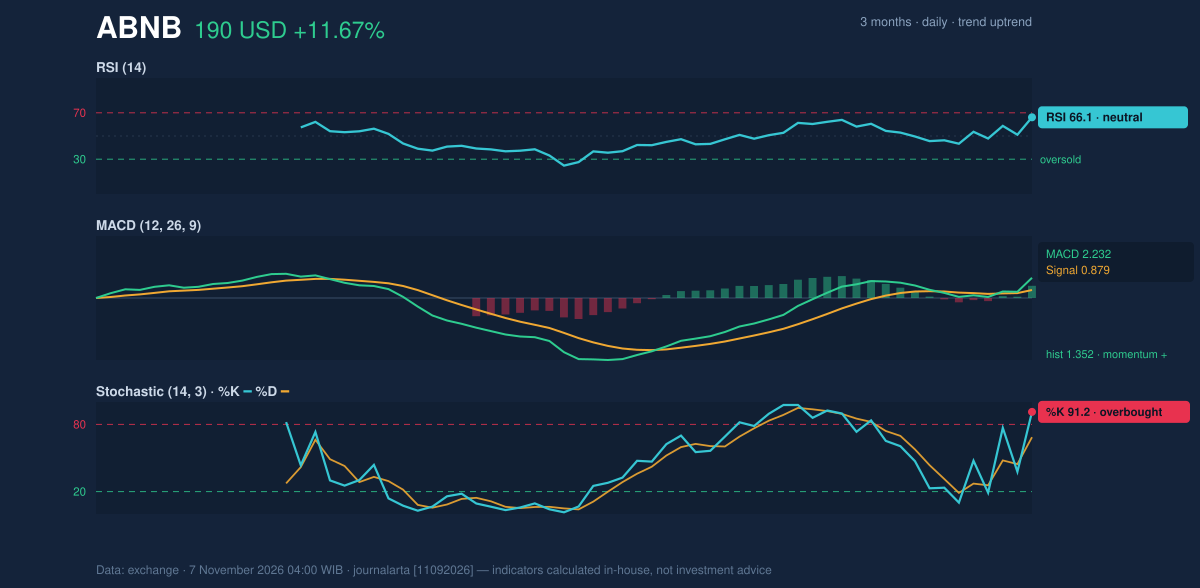
In plain terms, RSI says the rally is not yet extreme, while the Stochastic says the last few days were very strong. Overbought readings can persist during strong trends, but they also mean the next leg higher usually needs a pause first.
Volatility & Volume
Price closed above the upper Bollinger Band at 183.31, with %B at 128%. Bollinger Bands mark two standard deviations around the 20-day average, so a close outside them is statistically unusual. Band width is 13.8%, which is normal, so this is a breakout from an ordinary range rather than from a compressed squeeze. The Average True Range (ATR) of 6.66, or 3.5% of the price, confirms high volatility. Daily swings of that size are now routine for the stock.
Volume supports the move. The 2.9-times surge came with rising On-Balance Volume (OBV), a running tally that adds volume on up days and subtracts it on down days. A breakout on heavy volume suggests broad participation rather than a thin spike.
Fundamental Context
The move came a day after Airbnb's filings. According to its SEC filing (Form 10-Q, filed November 5, 2026), revenue for the quarter ended September 30 was $4.87 billion, up 18.9% from $4.10 billion a year earlier. Net income was $1.89 billion, compared with $1.37 billion in the same quarter a year before. Airbnb also filed a Form 8-K on November 5 reporting its results of operations and financial condition.
Key Levels & Scenarios
The nearest ceiling is the 3-month high of 193.45. A close above it would put price in territory not seen in three months, with the ATR-based level at 199.98 as the next reference. On the downside, the first cushion is the upper band at 183.31, then the level 1.5 ATR below the price at 180.00. A fall under that would suggest the breakout has failed. The deeper structural support is the 20-day low at 163.50, well below the current price.
Technical Verdict: BUY
The code-based bias is BULLISH, with 4 of 7 bullish signals and none of the 7 bearish ones, so the verdict is BUY on the indicators alone. The strongest reasons:
- Golden cross: SMA20 (171.46) crossed above SMA50 (169.07).
- Volume breakout: a close at the 20-day high on volume 2.9 times average, with rising OBV.
- MACD: the histogram has just turned positive at 1.352.
The caution is the Stochastic at 91.2, so a short pause is plausible. The verdict is invalidated if price falls below 180.00.
- Ideal entry range: 183.31–189.99 (upper Bollinger Band to the latest close)
- Exit target: 193.45 (3-month high); 199.98 if that level breaks
- Stop loss: below 180.00 (price minus 1.5 times ATR)
In plain English: the chart shows buyers firmly in control after a heavy-volume jump, but the price has already run far and fast, so a pause would not be surprising. This is technical analysis, not an investment recommendation.
Summary Data ABNB
| Last price | 189.99 USD |
| Change 1 day / 5 days / 1 month | 11.67% / 15.57% / 14.54% |
| Trend / MA-cross | uptrend / golden |
| SMA20 / SMA50 | 171.46 / 169.07 |
| RSI (14) / Stochastic %K | 66.1 / 91.2 |
| Bollinger %B / ATR | 128% / 6.66 |
| Support / Resistance 20 days | 163.50 / 189.99 |
| Data as of | 7 November 2026 04:00 WIB |
Disclaimer: This technical analysis is generated automatically from exchange data and indicators calculated by JournalArta, for information and education only. The verdict and the entry, target and stop-loss levels are not investment advice or a solicitation to buy or sell any security. Investment decisions and their risks rest solely with the reader.
Track ABNB stock price daily: live levels, support/resistance and our full ABNB analysis history.