Technical analysis of HSBC stock on November 6, 2026: price 1,304.60 GBp, trend downtrend, RSI 38.1, support 1,258.00, resistance 1,430.80.
By Alistair Sterling
November 9, 20265 min read
Advertisement
Logo HSBC Holdings — JournalArta illustration
Why HSBC is in focus today
MACD histogram has just turned positive
Selected automatically from 98 LSE (UK) stocks by a technical-signal score with daily weighted randomisation — not a recommendation.
HSBC Holdings closed at 1,304.60 pence on the London Stock Exchange on Friday, November 6, 2026, down 0.21% on the day from a previous close of 1,307.40. The picture is mixed. The shares are up 2.16% over five days but down 6.53% over one month, and the MACD histogram has just turned positive. That is why the stock stands out today: a possible shift in momentum inside a downtrend that has not yet broken.
Trend & Price Action
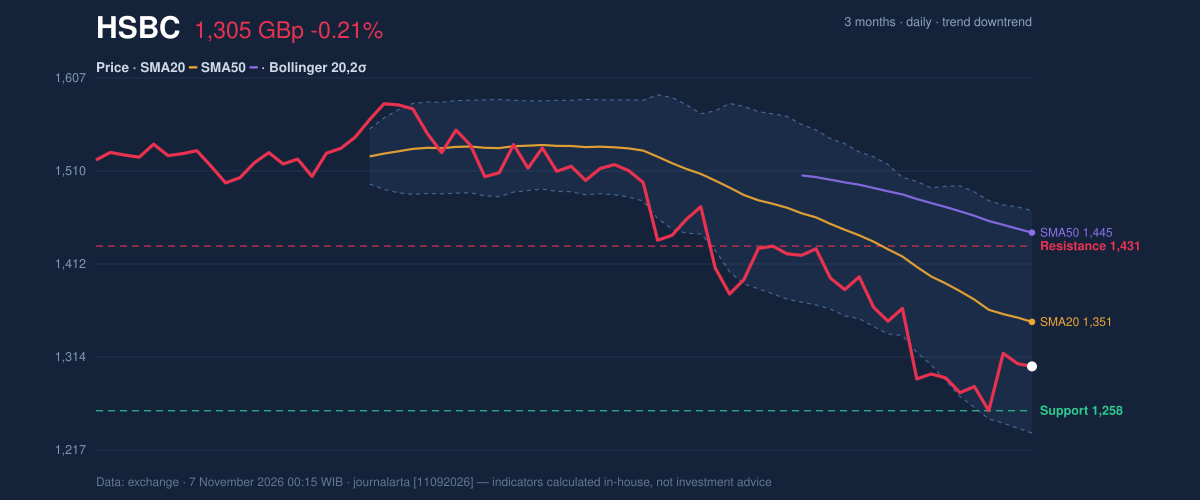
The trend is still down. The price sits below the 20-day average of 1,351.26, which in turn sits below the 50-day average of 1,444.95. That ordering, with the shorter average beneath the longer one, is the classic signature of a stock under sustained selling. The 20-day average itself fell 2.33% over five days, so the drift lower is still in the data. No new moving-average crossover has formed.
The stock is also close to the bottom of its range. The 3-month high is 1,585.00 and the 3-month low is 1,256.40. At 1,304.60, the price sits about 27% of the way up the 20-day range, which runs from support at 1,258.00 to resistance at 1,430.80. Only a few pence separate the 20-day support from the three-month low, so that area has already been tested.
3-month price action chart of HSBC: price, SMA20/50, Bollinger, support & resistance.
Advertisement
As the chart shows, the recent five-day gain looks like a bounce rather than a reversal. Price has not yet reclaimed the 20-day average, the first ceiling a recovery would have to clear.
Oscillators & Momentum
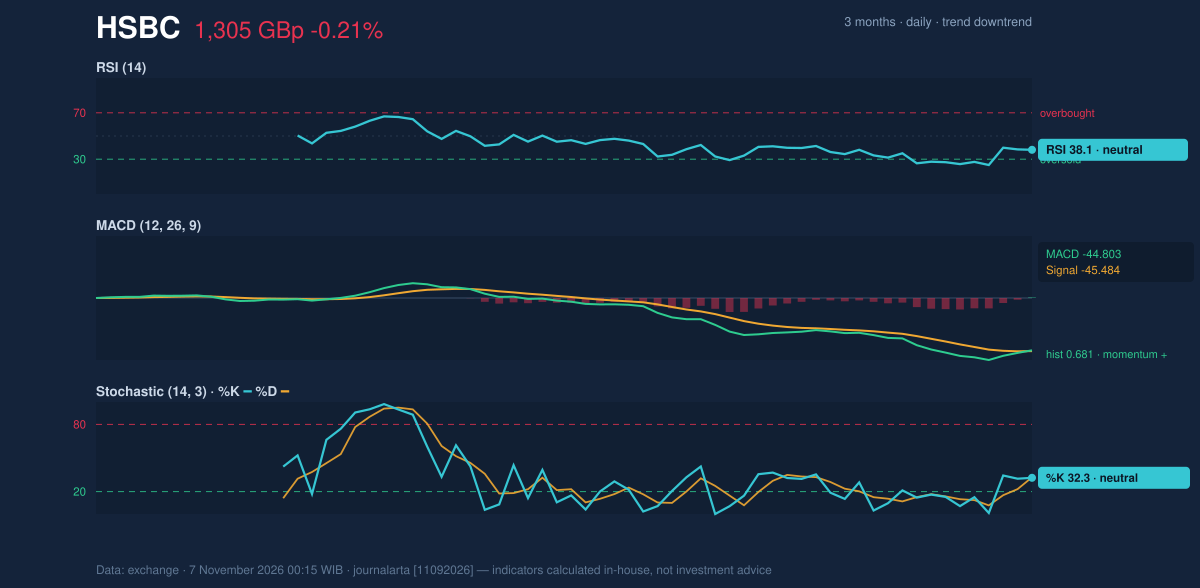
Momentum indicators are neutral, with a slight improvement at the margin. The RSI(14) is 38.1. This index measures how strongly prices have risen versus fallen over 14 sessions, and readings below 30 usually signal heavy selling. At 38.1 the stock is weak but not washed out. The Stochastic %K of 32.3 and %D of 32.7 tell the same story: the stock is closing in the lower third of its recent range, with no sharp turn yet.
The more interesting reading is the MACD, a trend-following gauge built from two moving averages. The MACD line is -44.803 against a signal line of -45.484, leaving a histogram of 0.681. The line has just edged above its signal. Both remain deeply negative, so this describes selling pressure that is fading, not buying pressure that has taken over. The histogram turning positive is the first sign of a pause. A convincing change of direction would need the MACD line itself to move toward zero.
Momentum chart of HSBC: RSI(14), MACD, Stochastic.
Advertisement
Volatility & Volume
The Bollinger Bands, which draw a channel two standard deviations around the 20-day average, run from 1,234.55 at the bottom to 1,467.97 at the top. The %B reading of 30% places the price in the lower part of that channel. Band width is 17.3%, which DATA classes as normal. There is no squeeze that would hint at a sudden, outsized move.
The Average True Range (ATR), a measure of typical daily movement, is 36.54 pence, or 2.8% of the price. That is moderate volatility. A day's swing of that size is about a quarter of the distance from the current price to the 20-day support.
Participation is the weak link. Friday's volume of 29,962,782 shares was 1.2 times the 20-day average of 24,391,019, so trading was busier than normal. Yet on-balance volume (OBV), which adds volume on up days and subtracts it on down days, is still falling. In plain terms, heavier trading has not yet shown up as net buying. Until OBV turns, the bounce lacks confirmation from the volume side.
Key Levels & Scenarios
Resistance comes first at the 20-day average of 1,351.26, then at 20-day resistance of 1,430.80. The ATR-based upper marker, price plus 1.5 times ATR, is 1,359.42, close to that first ceiling. On the downside, 20-day support at 1,258.00 is the line to watch, followed by the three-month low at 1,256.40 and the lower Bollinger Band at 1,234.55. The ATR-based lower marker is 1,249.78.
If the price holds above 1,258.00 and closes above the 20-day average, the rebound gains a foothold, and 1,430.80 becomes the next test. If it falls below 1,258.00, the three-month low is exposed and the downtrend would be reinforced.
Advertisement
Technical Verdict: HOLD (wait & see)
The code-computed bias is neutral: two of seven bullish signals (RSI rebounding from below 35 and the fresh MACD histogram turn) against two of seven bearish ones (a bounce into the 20-day average within a downtrend, and falling OBV). The verdict is HOLD (wait & see).
Three reasons stand behind it:
Trend: price is below both the 20-day (1,351.26) and 50-day (1,444.95) averages, so the downtrend has not been reversed.
Momentum: the MACD histogram has turned positive at 0.681, but the MACD line (-44.803) remains deeply negative and RSI is a neutral 38.1.
Volume: OBV is falling despite volume running 1.2 times its 20-day average, so the bounce is unconfirmed.
Technical levels drawn only from the data:
Ideal entry range: 1,258.00 to 1,304.60, between the 20-day support and the current price.
Stop loss: below 1,249.78 (price minus 1.5 times ATR), just under the 20-day support and the three-month low of 1,256.40.
Advertisement
The verdict is invalidated if the price falls below 1,258.00 or closes above 1,430.80.
In plain terms: the selling has slowed but not stopped, and the chart needs a close above the 20-day average before a recovery looks credible. This is technical analysis, not an investment recommendation.
Summary Data HSBC
Last price
1,304.60 GBp
Change 1 day / 5 days / 1 month
-0.21% / 2.16% / -6.53%
Trend / MA-cross
downtrend / none
SMA20 / SMA50
1,351.26 / 1,444.95
RSI (14) / Stochastic %K
38.1 / 32.3
Bollinger %B / ATR
30% / 36.54
Support / Resistance 20 days
1,258.00 / 1,430.80
Data as of
7 November 2026 00:15 WIB
Disclaimer: This technical analysis is generated automatically from exchange data and indicators calculated by JournalArta, for information and education only. The verdict and the entry, target and stop-loss levels are not investment advice or a solicitation to buy or sell any security. Investment decisions and their risks rest solely with the reader.