Vodafone Share Price Falls 2.43% (November 6, 2026): Testing Support Level
Technical analysis of Vodafone stock on November 6, 2026: price 116.50 GBp, trend downtrend, RSI 42.4, support 116.50, resistance 122.05.

Vodafone Group shares closed at 116.50 pence on the London Stock Exchange on Friday, November 6, 2026, the lowest finish in 20 trading sessions. The stock fell 2.43% on the day from a previous close of 119.40, and is down 2.18% over five days and 1.56% over one month. It now sits just above its three-month low of 114.30.
Why Vodafone is in focus today
- Closed at a 20-day low (116.50)
- Trading near its 3-month low (114.30)
- Downtrend extending (5-day change -2.18%)
Selected automatically from 98 LSE (UK) stocks by a technical-signal score with daily weighted randomisation — not a recommendation.
Trend & Price Action
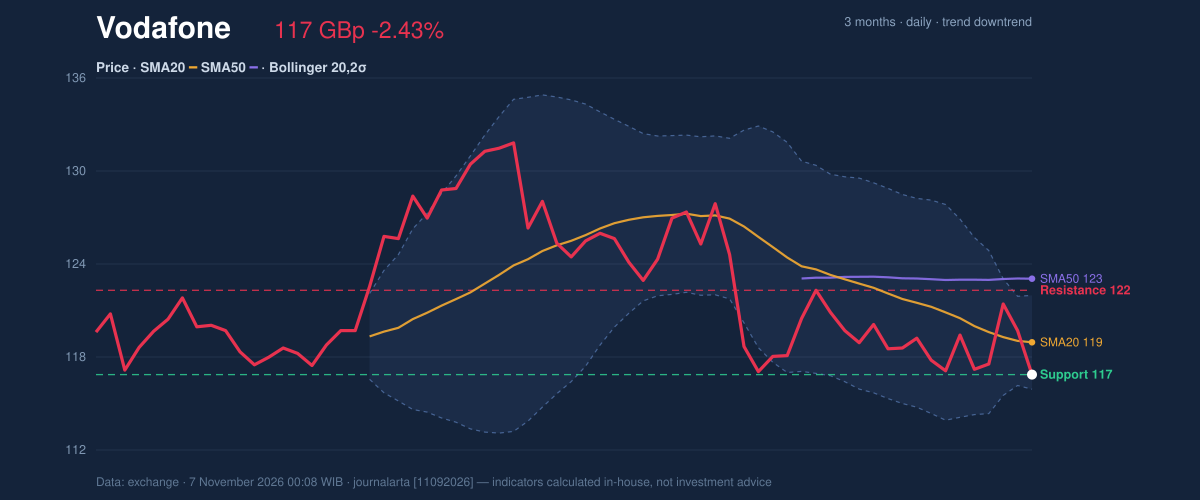
The slide is not new. The 20-day moving average, which smooths out daily noise, rose or fell in line with the stock and has dropped 1.32% over five days. The price sits below both the 20-day average at 118.63 and the 50-day average at 122.81. When the shorter average trades under the longer one and both slope down, sellers have controlled the stock's direction. DATA shows no fresh crossover between the two averages, so this is a continuing downtrend rather than a new turn.
The stock closed at the bottom of its 20-day range: support at 116.50, resistance at 122.05, with the price at 0% of that band. As shown in the chart below, the gap between price and the 50-day average has widened, which shows how far sentiment has sunk since the stock last traded at the top of its range.
Oscillators & Momentum
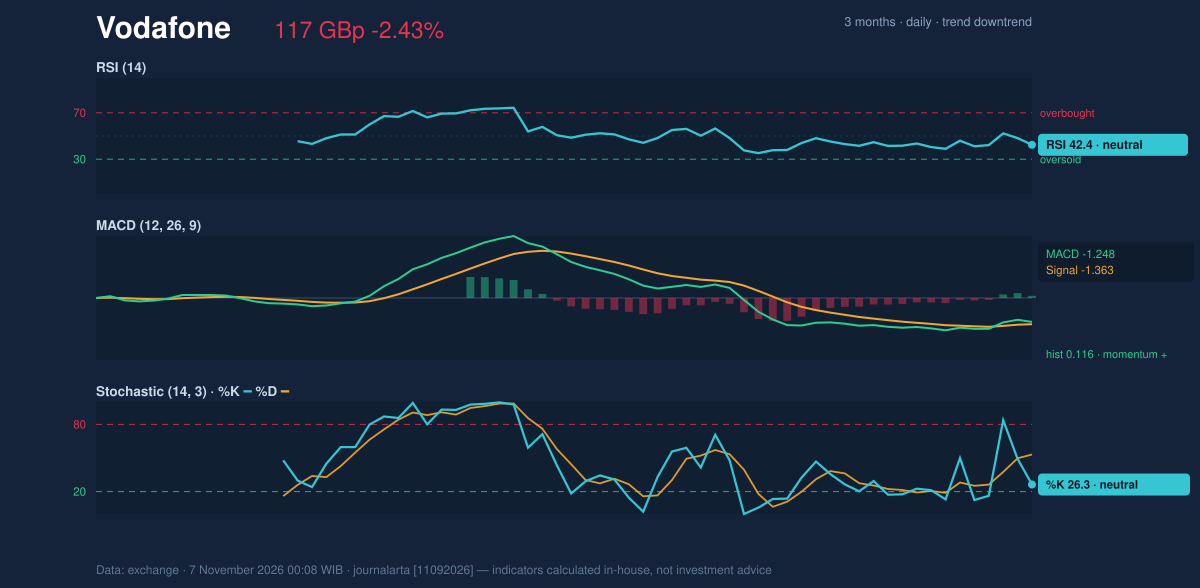
Momentum gauges are less gloomy than price. The RSI(14) is 42.4, neutral territory. The index measures the pace of recent gains against losses on a 0–100 scale, and readings below 30 are usually called oversold. At 42.4, Vodafone is weak but not stretched. The Stochastic %K is 26.3 against a %D of 53.1. That gap shows the stock closing near the low end of its recent range, with the fast line sitting well under the slow one.
The MACD sits at -1.248, above its signal line at -1.363, leaving a histogram of 0.116. The line itself is still negative, so the longer-term picture is bearish. But the histogram has just turned positive, which means downward momentum is fading rather than accelerating. This is the one bullish signal in the code-computed bias. It is also the main reason the overall reading is neutral rather than bearish. The rest of the oscillators in the chart below show a stock that is leaning down but not collapsing.
Volatility & Volume
Bollinger Bands, which draw a channel two standard deviations around the 20-day average, have narrowed to 5.2% wide, with the lower band at 115.54 and the upper at 121.71. Narrow bands often precede a larger move, though they do not say which way. The price's %B reading is 16%, meaning it sits in the lower part of the channel and not far above the lower band.
The Average True Range, a measure of the typical daily swing, is 2.63 pence, or 2.3% of the price. That is moderate volatility. A daily move of that size would be enough to carry the stock from support to the 20-day average in a single session.
Volume tells a mixed story. Friday's turnover was 39,244,142 shares, or 0.6 times the 20-day average of 61,831,337. A fall on thin volume suggests that sellers are not rushing out, and the on-balance volume line, which tracks whether volume flows in on up days or down days, is rising. That makes a case against heavy distribution, though low participation can also mean buyers are absent.
Key Levels & Scenarios
The nearest floor is the 20-day support at 116.50, where the stock closed. Below it lies the three-month low of 114.30. A close under that level would put the stock at its weakest in at least three months. On the upside, a move back through the 20-day average at 118.63 and the band-based level at 120.44 (price plus 1.5 times ATR) would be the first sign of recovery. The 20-day resistance at 122.05 and the three-month high of 132.07 sit further out.
Technical Verdict: HOLD
The code-computed bias is neutral, with one bullish and one bearish signal out of seven on each side. The verdict is HOLD (wait & see), for three reasons:
- Trend: price is below both the 20-day and 50-day averages, and the 20-day average is falling.
- Momentum: the MACD histogram has turned positive at 0.116, while RSI at 42.4 is neutral.
- Volume: OBV is rising even as turnover is only 0.6 times normal.
Reference levels from the data, for technical study only:
- Ideal entry range: 116.50 to 118.63 (20-day support up to the 20-day average)
- Exit target: 120.44 first, then 122.05 (20-day resistance)
- Stop loss: 112.56 (price minus 1.5 times ATR), below the three-month low of 114.30
The verdict is invalidated if the price breaks below 114.30. This is technical analysis, not investment advice.
In plain terms: Vodafone's shares are drifting down but not yet breaking down, so the chart gives no clear signal either way, and the stock closed Friday just 2.20 pence above its three-month low.
Summary Data Vodafone
| Last price | 116.50 GBp |
| Change 1 day / 5 days / 1 month | -2.43% / -2.18% / -1.56% |
| Trend / MA-cross | downtrend / none |
| SMA20 / SMA50 | 118.63 / 122.81 |
| RSI (14) / Stochastic %K | 42.4 / 26.3 |
| Bollinger %B / ATR | 16% / 2.63 |
| Support / Resistance 20 days | 116.50 / 122.05 |
| Data as of | 7 November 2026 00:08 WIB |
Disclaimer: This technical analysis is generated automatically from exchange data and indicators calculated by JournalArta, for information and education only. The verdict and the entry, target and stop-loss levels are not investment advice or a solicitation to buy or sell any security. Investment decisions and their risks rest solely with the reader.
Track Vodafone share price daily: live levels, support/resistance and our full Vodafone analysis history.