Aviva Share Price Falls 2.50%, Golden Cross Formed In Focus
Technical analysis of Aviva stock on November 6, 2026: price 733.80 GBp, trend uptrend, RSI 58.9, support 687.40, resistance 752.60.
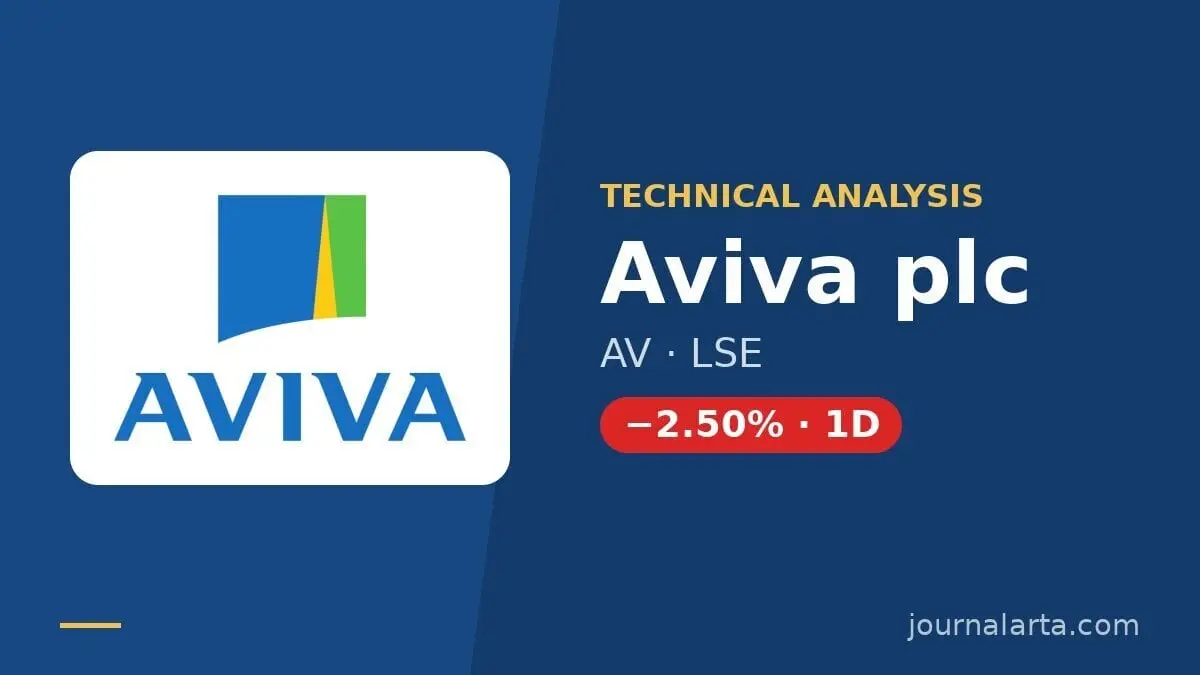
Aviva shares slipped on Friday, but the drop came with a fresh long-term trend signal that points the other way. For international investors tracking UK insurers, the stock ended the session on the London Stock Exchange at 733.80 pence, down 2.50% on the day from a previous close of 752.60. Over five days the change was 0.00%, and over one month the shares are up 8.39%. The session was Friday, November 6, 2026. The fall was about 1.5 times the stock's average daily range, which is why it stands out. Yet a golden cross formed two sessions before that session, so the pullback arrives just after the longer-term picture turned positive.
Why Aviva is in focus today
- One-day move of -2.50%, about 1.5× its average daily range (ATR)
- Fresh golden cross: SMA20 crossed above SMA50
- Not covered by JournalArta in the last 14 days
Selected automatically from 98 LSE (UK) stocks by a technical-signal score with daily weighted randomisation — not a recommendation.
Trend & Price Action
A golden cross happens when the faster moving average (the 20-day, or SMA20) climbs above the slower one (the 50-day, or SMA50). Traders read it as a sign that recent prices are outrunning the longer-term average. Here, the SMA20 sits at 718.51 and the SMA50 at 709.95. The cross formed two sessions before the latest session, so it is recent but not new on Friday. The 20-day average itself rose 2.14% over five days, which shows the trend is still tilting upward rather than flattening.
Friday's fall still left the price above the SMA20, with the average acting as a nearby floor. As shown in the chart, price is also well clear of the SMA50. The stock sits at about 71% of its 20-day range, between support at 687.40 and resistance at 752.60. The 3-month high is 761.60 and the 3-month low is 668.60.
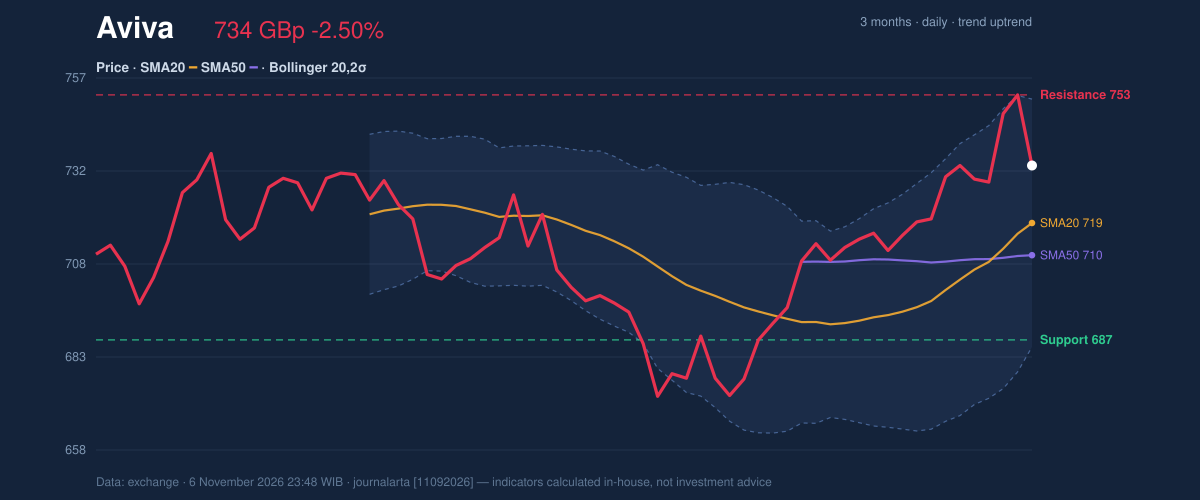
The 20-day resistance of 752.60 matches the previous close. That means Friday's decline began from the top of the recent range, and sellers took the stock back from a level where it had already stalled.
Oscillators & Momentum
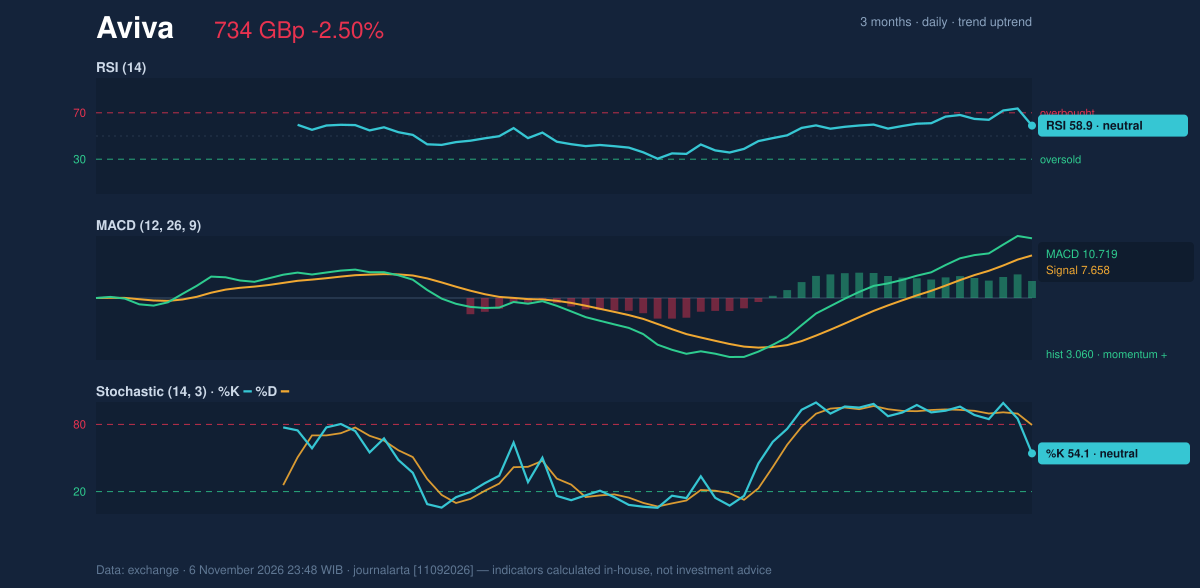
Momentum gauges give a mixed but mostly constructive message. The Relative Strength Index (RSI), which measures how strong recent gains are against recent losses on a 0–100 scale, reads 58.9. That is neutral: the stock is neither stretched nor oversold. The Stochastic oscillator, which compares the close with its recent high-low range, has %K at 54.1 below %D at 79.5. This is a sign that short-term momentum has cooled after the run-up, and it fits a one-day pullback rather than a broken trend.
The MACD, a trend-following gauge built from two moving averages, supports the bigger picture. The line is at 10.719 against a signal line of 7.658, leaving a histogram of 3.060, which signals positive momentum. As the chart below shows, the MACD has not yet turned down, even as the faster Stochastic has.
Volatility & Volume
Bollinger Bands, which draw a channel two standard deviations around the 20-day average, run from 685.54 at the bottom to 751.48 at the top. The price is at a %B of 73%, meaning it sits in the upper part of the channel but not at the edge. Band width of 9.2% is classed as normal, so there is no squeeze hinting at an imminent breakout. The Average True Range (ATR), a measure of typical daily movement, is 11.86, or 1.6% of the price. That is moderate volatility, so a move of that size in either direction is ordinary for this stock.
Volume adds an important caveat. Friday's turnover of 4,039,506 shares was only 0.7 times the 20-day average of 5,403,162. A 2.5% fall on thin trading suggests selling was not heavily backed. The On-Balance Volume (OBV) indicator, which tallies volume on up days against down days, is still rising, so buying participation over recent weeks has not been undone by one quiet session.
Key Levels & Scenarios
The code-computed technical bias is bullish, with three of seven bullish signals: the fresh golden cross, a pullback toward the SMA20 within an uptrend, and a rising OBV. One of seven bearish signals is active, an RSI rolling over from above 65. If the price recovers and clears 752.60, the next reference is the 3-month high of 761.60. If it fails to hold the SMA20 near 718.51, attention shifts to the 20-day support at 687.40, close to the lower Bollinger band at 685.54.
Technical Verdict: BUY
The indicator picture is consistent with a BUY bias, matching the computed technical bias. This is technical analysis, not an investment recommendation.
- Golden cross: the SMA20 (718.51) is above the SMA50 (709.95), and the 20-day average rose 2.14% over five days.
- MACD: the line (10.719) is above its signal (7.658), with a positive histogram of 3.060.
- OBV: still rising, while Friday's fall came on volume at only 0.7 times average.
- Ideal entry range: 716.01 (price minus 1.5×ATR) to 733.80 (last price), near the SMA20 at 718.51.
- Exit target: 752.60, the 20-day resistance (3-month high 761.60 once above it).
- Stop loss: below 687.40, the 20-day support.
The verdict is invalidated if the price breaks below 687.40.
In plain terms: the longer-term trend has turned up, and Friday's drop looks like a pause on light trading rather than a reversal, unless the stock falls below 687.40.
Summary Data Aviva
| Last price | 733.80 GBp |
| Change 1 day / 5 days / 1 month | -2.50% / 0.00% / 8.39% |
| Trend / MA-cross | uptrend / golden |
| SMA20 / SMA50 | 718.51 / 709.95 |
| RSI (14) / Stochastic %K | 58.9 / 54.1 |
| Bollinger %B / ATR | 73% / 11.86 |
| Support / Resistance 20 days | 687.40 / 752.60 |
| Data as of | 6 November 2026 23:48 WIB |
Disclaimer: This technical analysis is generated automatically from exchange data and indicators calculated by JournalArta, for information and education only. The verdict and the entry, target and stop-loss levels are not investment advice or a solicitation to buy or sell any security. Investment decisions and their risks rest solely with the reader.
Track Aviva share price daily: live levels, support/resistance and our full Aviva analysis history.