Technical analysis of DBS stock on November 6, 2026: price 69.72 SGD, trend downtrend, RSI 22.5, support 69.72, resistance 74.65.
By Elena Vance
November 8, 20264 min read
Advertisement
Logo DBS Group — JournalArta illustration
Why DBS is in focus today
Volume at 1.8× the 20-day average
Closed at a 20-day low (69.72)
Trading near its 3-month low (69.00)
RSI(14) at 22.5 — oversold zone
Downtrend extending (5-day change -4.66%)
Selected automatically from 32 SGX (Singapore) stocks by a technical-signal score with daily weighted randomisation — not a recommendation.
DBS Group closed at S$69.72 on Friday, November 6, 2026, down 2.08% for the session, as trading volume jumped to 1.8 times its 20-day average. The close sat at the 20-day low and near the three-month low, while the five-day loss reached 4.66%. That combination matters: the oversold readings suggest selling has become stretched, but heavy volume and falling on-balance volume—the measure of whether trading is accumulating or distributing shares—show that sellers still have the stronger hand.
Trend & Price Action
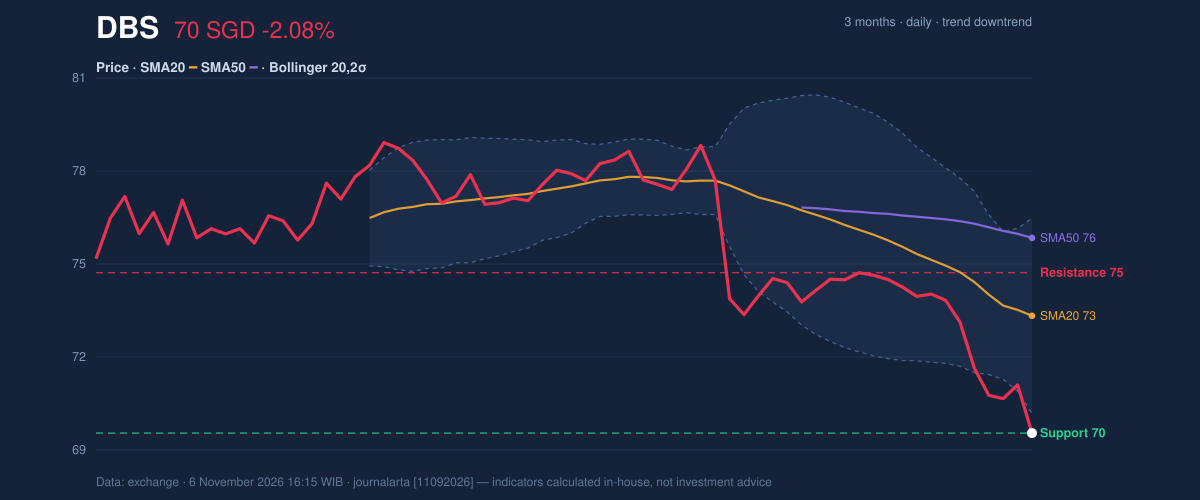
DBS remains in a downtrend. Its share price is below both the 20-day moving average, at S$73.32, and the 50-day average, at S$75.72. The 20-day average itself fell 1.79% over five days, so the weakness is not just a sharp move in the share price: the short-term trend line is also declining. No new moving-average crossover has formed.
The close was at the bottom of the stated 20-day range and only S$0.72 above the three-month low of S$69.00. It also finished below the Bollinger lower band of S$70.33. Bollinger bands track price relative to recent volatility; a close below the lower band signals unusually forceful downward pressure, not proof that a rebound is imminent. The band width was normal, so the move did not come from an unusually compressed volatility range.
Price below both moving averages, a falling 20-day average and a lower-band break keep the trend structure bearish. The proximity to the three-month low makes the next test consequential.
3-month price action chart of DBS: price, SMA20/50, Bollinger, support & resistance.
Advertisement
Oscillators & Momentum
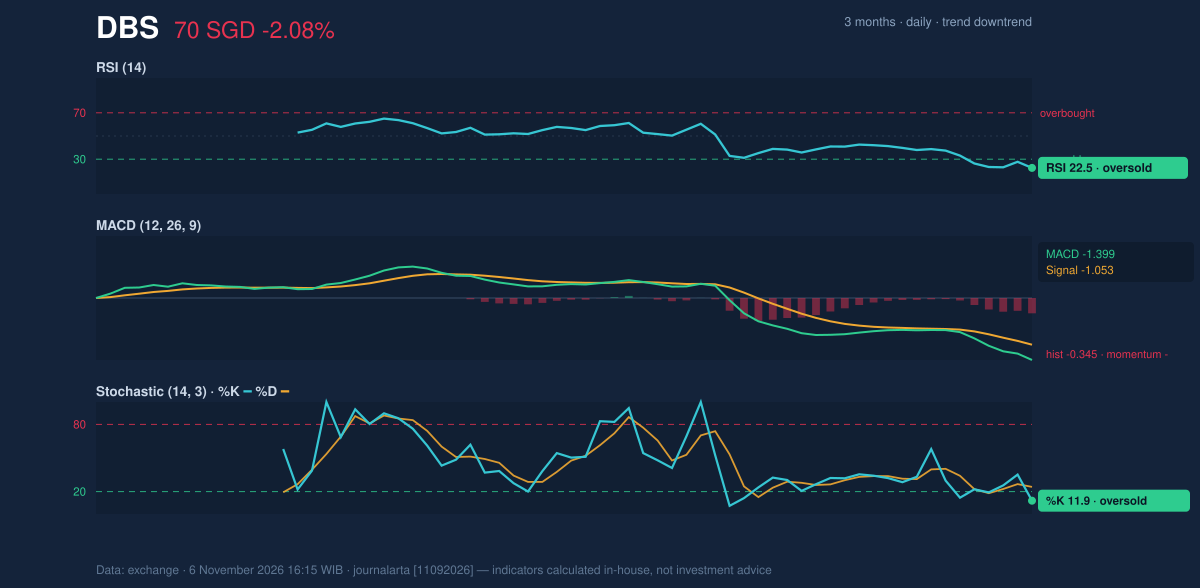
Momentum indicators show the tension between stretched conditions and continued downside pressure. The RSI is 22.5, in oversold territory, while the Stochastic readings are also oversold, with %K at 11.9 and %D at 24.2. These measures compare recent gains and losses; low readings can indicate that selling has been intense, but they do not by themselves establish that a price bottom is in place.
The MACD remains negative at -1.399, below its -1.053 signal line, with a negative histogram of -0.345. That alignment points to downside momentum still outweighing any early reversal signal. In other words, the oscillators flag vulnerability to a bounce, while MACD says the prevailing pressure has not yet turned.
Momentum chart of DBS: RSI(14), MACD, Stochastic.
Volume, Volatility & Key Levels
Volume reached 9,629,710 shares against a 20-day average of 5,267,664. The 1.8-times surge on a close at the 20-day low is a warning that selling had broad participation. OBV also fell, reinforcing the view that trading flows have not yet confirmed accumulation. ATR, a measure of typical price movement, stood at S$1.21, or 1.7% of the share price, indicating moderate volatility.
The immediate reference is S$69.72, the 20-day support, with the S$69.00 three-month low just below it. If the price fails to hold that zone, the next cited downside reference is S$67.90, calculated as the last price minus 1.5 times ATR. On a recovery, S$74.65 is the 20-day resistance; clearing it would put the 20-day average at S$73.32 behind the price, but the 50-day average at S$75.72 and the three-month high at S$79.05 remain higher references.
Advertisement
Technical Verdict: SELL
The bearish technical bias is supported by three signals: a close at the 20-day low on volume 1.8 times average, a close below the lower Bollinger band, and falling OBV. Oversold RSI and Stochastic readings raise the risk of a countertrend bounce, but MACD remains negative and does not confirm a turn. The verdict is invalidated if the price breaks above S$74.65, the stated 20-day resistance.
Indicative entry range: S$69.72–S$71.54, using the 20-day support and the price-plus-1.5-ATR reference.
Indicative target: S$69.00, the three-month low; S$67.90 is the next cited downside reference if that level gives way.
Risk boundary: S$74.65, the 20-day resistance.
The chart still points down, although deeply oversold readings mean a short-term rebound remains possible.
Summary Data DBS
Last price
69.72 SGD
Change 1 day / 5 days / 1 month
-2.08% / -4.66% / -4.96%
Trend / MA-cross
downtrend / none
SMA20 / SMA50
73.32 / 75.72
RSI (14) / Stochastic %K
22.5 / 11.9
Bollinger %B / ATR
-10% / 1.21
Support / Resistance 20 days
69.72 / 74.65
Data as of
6 November 2026 16:15 WIB
Advertisement
Disclaimer: This technical analysis is generated automatically from exchange data and indicators calculated by JournalArta, for information and education only. The verdict and the entry, target and stop-loss levels are not investment advice or a solicitation to buy or sell any security. Investment decisions and their risks rest solely with the reader.