UOB Stock Week Ahead: Technical Outlook for November 9–13
UOB stock week ahead for November 9–13: last close 36.88 SGD, weekly change -10.85%, support 36.88, resistance 42.00.
By matthew jonathan
November 8, 20265 min read
Advertisement
Logo United Overseas Bank — JournalArta illustration
Last Week in Review
UOB fell 10.85% in the week to November 6, closing at SG$36.88 after every session ended lower. The decline was accompanied by heavier trading: average daily volume reached 6,396,684 shares, or 1.77 times the average for the preceding 20 sessions.
The stock opened the week at SG$41.10 and reached a high of SG$41.21 on November 2, before sliding to a weekly low of SG$36.54 on November 6. The worst session was November 4, down 4.99%; even the week’s best session, November 3, fell 0.49%. UOB ended near the bottom of its weekly range, underscoring the persistence of selling pressure into the weekend.
Technical Map for the Week Ahead
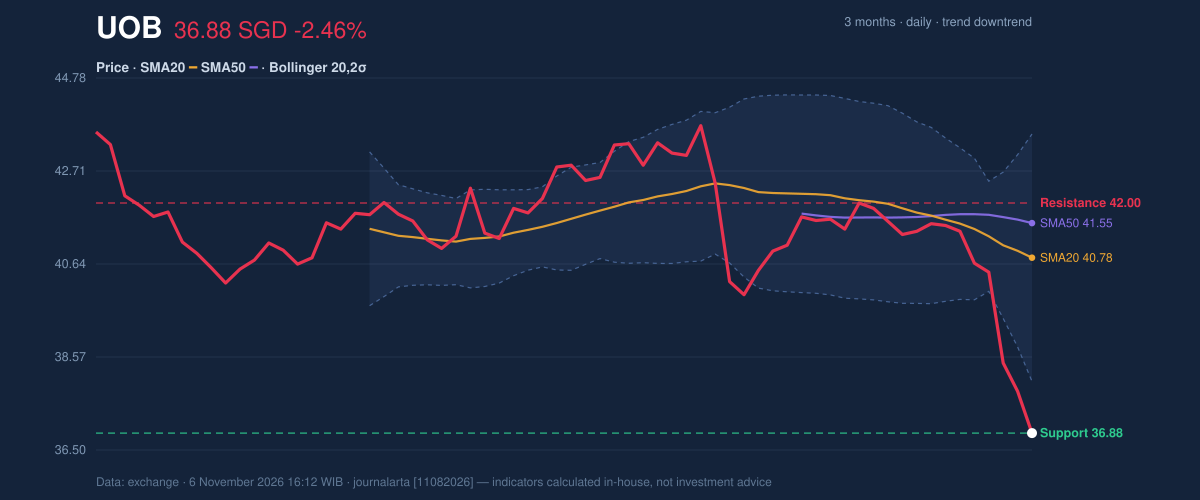
UOB enters the November 9–13 trading week below its 20-day moving average of SG$40.78 and its 50-day moving average of SG$41.55. The 20-day average is falling at 1.83% over five days, consistent with the downtrend. The 20-day support is SG$36.88, the closing level on November 6, while resistance is SG$42.00. The three-month range runs from SG$36.54 to SG$43.75.
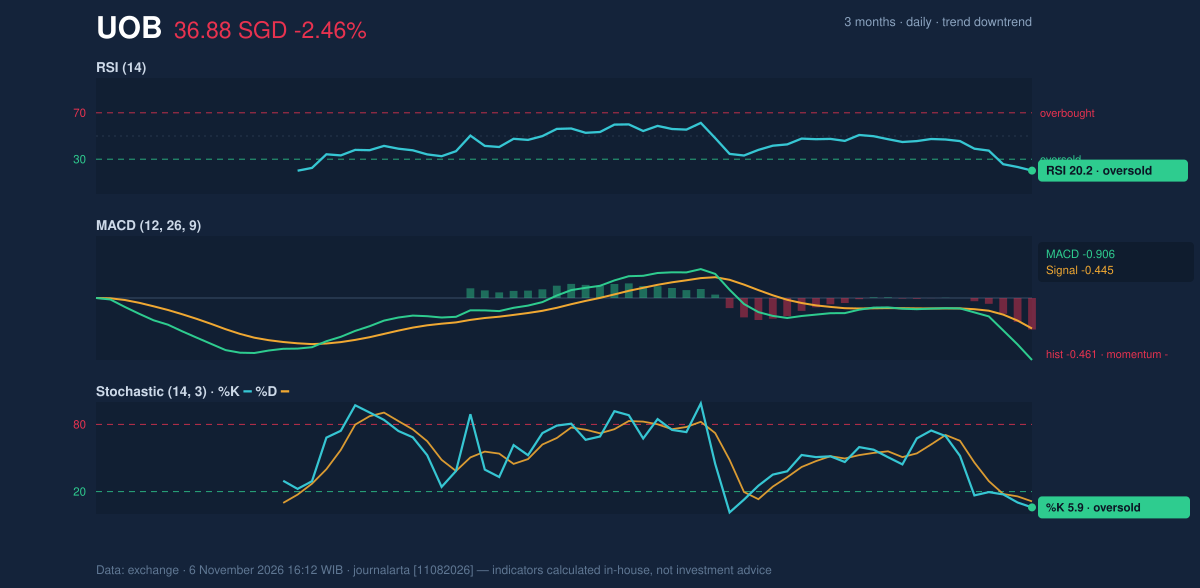
The close was below the lower Bollinger Band, at SG$38.03, with %B at -21%. Bollinger Bands compare price with a recent average and its typical volatility; a reading below the lower band signals an unusually weak close relative to that range. RSI, a gauge of recent price momentum, stood at 20.2, while Stochastic readings of 5.9 and 11.2 were also in oversold territory. These measures can reflect intense selling, but do not by themselves confirm that a decline has ended.
MACD was negative at -0.906 against a signal line of -0.445, with a negative histogram of -0.461, indicating weakening momentum. The chart places that move in context.
3-month price action chart of UOB: price, SMA20/50, Bollinger, support & resistance.
Advertisement
The momentum chart shows how deeply short-term indicators have moved into oversold territory.
Momentum chart of UOB: RSI(14), MACD, Stochastic.BULLISH SCENARIO: A move back above the lower Bollinger Band at SG$38.03 would be an early sign of recovery; a stronger test would be a break above the 20-day resistance at SG$42.00. That would challenge the prevailing downtrend, although the moving averages remain higher.
BEARISH SCENARIO: A fall below the 20-day support at SG$36.88 would put the three-month low of SG$36.54 in focus. The data also show an ATR-based reference at SG$35.57, calculated as the latest price minus 1.5 times average true range, a measure of typical price movement.
Fundamentals and Catalysts
UOB reported third-quarter 2026 net profit of SG$1.25 billion, below the mean estimate of SG$1.35 billion from two analysts, according to LSEG data, on November 5. Profit was more than double the year-earlier level, but that comparison was against a low base following a surge in credit provisions.
The quarter also highlighted pressure on lending profitability. UOB said its net interest margin narrowed by six basis points from the previous quarter to 1.68%, attributing the decline to higher funding costs, in information published November 5. Chief Financial Officer Leong Yung Chee said full-year 2026 net interest margin was likely to fall below 1.75%, revising the previous quarter’s guidance of 1.75% to 1.80%, according to the same date’s company update. A narrower margin can weigh on the income banks earn from lending relative to funding.
There were areas of strength in fee-generating business. UOB reported record third-quarter wealth management fees of SG$258 million and net new money of SG$5 billion in the first nine months of 2026, in information published November 5. Those figures offer a counterpoint to the margin pressure, while the earnings shortfall and revised margin guidance remain relevant to the market’s assessment of the results.
Advertisement
Macro, Political and Global Factors
No macroeconomic, political or global developments were included in the supplied research. The week-ahead assessment therefore rests on the company’s reported results and the market data, without adding assumptions about external policy or economic conditions.
Risks and What Would Invalidate the Scenario
The immediate technical risk is a break below SG$36.88, the stated 20-day support and the week’s closing price. The three-month low of SG$36.54 is the next reference level in the supplied data. A close below the lower Bollinger Band, falling OBV (a measure of whether volume is accumulating on rising or falling days) and volume at twice the 20-session average reinforce the bearish reading. Oversold RSI and Stochastic readings can leave room for a rebound, but they do not erase the trend and volume signals.
The bearish setup would be challenged by a recovery above SG$42.00, the 20-day resistance. On the fundamental side, the reported shortfall against analyst estimates and the lower margin guidance are risks to sentiment; record wealth management fees and net new money provide an offset, not a resolution of the margin pressure.
Advertisement
Technical Verdict for the Week: SELL
The verdict follows the data’s bearish technical bias. The price closed below the lower Bollinger Band at SG$38.03; MACD remained negative, with a -0.461 histogram; and OBV was falling as volume ran at 2.0 times its 20-session average. RSI at 20.2 signals oversold conditions, but that reading alone does not overturn those bearish indicators.
- Entry Range: SG$36.88–SG$38.19, using 20-day support and the price-plus-1.5-ATR reference.
- Target Price: SG$36.54, the three-month low.
- Stop Loss: SG$42.00, the 20-day resistance.
The verdict is invalidated if price breaks above SG$42.00. In plain English, the chart still points to downside pressure, though an oversold reading means sharp short-term moves remain possible.
UOB Week Ahead Data
Trading week
November 2 – November 6 (5 sessions)
Weekly change
-10.85% (41.37 → 36.88 SGD)
Week high / low
41.21 (November 2) / 36.54 (November 6)
Best / worst session
-0.49% (November 3) / -4.99% (November 4)
Avg daily volume vs prior 20 sessions
6,396,684 vs 3,606,218 (1.77x)
SMA20 / SMA50
40.78 / 41.55
RSI (14) / Stochastic %K
20.2 / 5.9
Support / Resistance 20 days
36.88 / 42.00
3-month high / low
43.75 / 36.54
Week covered
November 9–13, 2026
Data as of
6 November 2026 16:12 WIB
Advertisement
Disclaimer: This technical analysis is generated automatically from exchange data and indicators calculated by JournalArta, for information and education only. The verdict and the entry, target and stop-loss levels are not investment advice or a solicitation to buy or sell any security. Investment decisions and their risks rest solely with the reader.