MSFT Stock Week Ahead: Levels and Scenarios for November 9–13
MSFT stock week ahead for November 9–13: last close 530.61 USD, weekly change 1.67%, support 507.12, resistance 555.80.
By matthew jonathan
November 7, 20264 min read
Advertisement
Logo Microsoft — JournalArta illustration
Last Week in Review
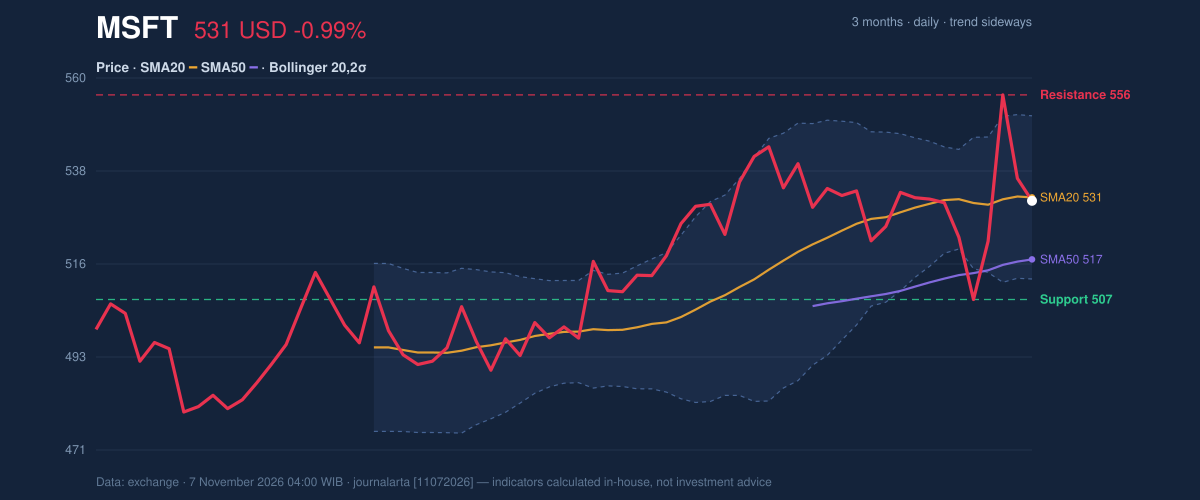
3-month price action chart of MSFT: price, SMA20/50, Bollinger, support & resistance.
Microsoft gained 1.67% in the week ended November 6, closing at $530.61 after a volatile run between $504.96 and $559.15. The shares finished near the middle of that range, at 47% of its span, despite the net advance.
The strongest session was November 4, when the stock rose 6.68%; the weakest was November 5, with a 3.58% decline. Microsoft rose in two sessions and fell in three. Average daily volume reached 35,001,520 shares, or 1.59 times the average for the preceding 20 sessions, pointing to unusually active trading during the sharp swings.
Technical Map for the Week Ahead
Microsoft enters the November 9–13 week just below its 20-day moving average. The last close of $530.61 was under the SMA20 at $531.41, but above the SMA50 at $516.65. That places price between a near-term trend test and a longer moving-average support, with no new moving-average crossover recorded.
The 20-day support is $507.12 and resistance is $555.80. The three-month range extends from $477.15 to $559.15, making the recent weekly high a nearby reference if resistance gives way. Bollinger bands are narrowing: the upper band is $550.82, the middle band $531.41 and the lower band $511.99, with a 7.3% band width. A squeeze means volatility has contracted, which can precede a larger move but does not determine its direction.
[ GRAFIK-HARGA ]
Momentum readings remain mixed. RSI(14) is 51.8, a neutral level, while the Stochastic is also classified as neutral at 47.3 for %K and 66.1 for %D. MACD is 3.865 against a 4.215 signal line, with a negative histogram of -0.350. The 20-day average’s slope is slightly positive at 0.08% over five days, while declining OBV suggests volume flow has weakened.
[ GRAFIK-MOMENTUM ]
BULLISH SCENARIO: A sustained break above $555.80 would clear 20-day resistance and bring the three-month high at $559.15 into focus. The stock is above its SMA50, and its RSI remains neutral rather than stretched.
BEARISH SCENARIO: A move below $507.12 would break 20-day support. The lower Bollinger band at $511.99 and the ATR-based reference at $506.80 provide nearby technical markers; below support, the three-month low at $477.15 is the next broader range reference.
Advertisement
Fundamentals and Catalysts
Microsoft reported quarterly revenue of $92.28 billion for the quarter ended September 30, up 18.8% from $77.67 billion a year earlier, in a Form 10-Q filed on October 28. Net income was $36.63 billion, compared with $27.75 billion a year earlier, while diluted earnings per share were $4.92.
In a fact published October 29, Microsoft’s diluted EPS was reported as up 32% on a GAAP basis and above the Street estimate of $4.71 to $4.72. The results provide a fundamental backdrop to a chart that is currently testing its short-term average rather than displaying a clear directional trend.
The company also filed a Form 8-K with the U.S. Securities and Exchange Commission on November 5 reporting a change of directors or officers, and another on November 4 reporting other material events. Those filings are company disclosures; the available information does not specify further details for assessing their market significance.
Macro, Political and Global Factors
No dated macroeconomic, political or global developments were supplied in the research material. The week-ahead assessment therefore rests on the disclosed company information and the market data, without assigning an external policy or economic catalyst.
Advertisement
Risks and What Would Invalidate the Scenario
The neutral technical bias reflects a contest between support from the SMA50 and weak short-term momentum. A close above $555.80 would challenge the neutral range structure; a break below $507.12 would undermine it on the downside. The SMA20 at $531.41 is a nearer pivot, but the indicators do not establish it as a decisive breakout level.
MACD’s negative histogram and falling OBV are risks to an upside case, while the narrowing Bollinger bands raise the prospect of a sharper move without signaling its direction. The previous week’s elevated volume and wide 10.73% trading range also show that price can move considerably around technical levels. Company filings dated November 4 and November 5 add disclosure items, but the supplied research does not establish a specific financial impact.
Technical Verdict for the Week: HOLD
The verdict is HOLD (wait & see), consistent with the neutral technical bias. RSI at 51.8 is neutral, price remains above the SMA50 at $516.65, and the MACD histogram at -0.350 signals negative short-term momentum rather than a confirmed turn. The first condition that would invalidate this neutral range view is a break below 20-day support at $507.12.
Entry Range: $511.99–$531.41, using the lower Bollinger band and SMA20 as reference levels.
Target Price: $555.80, the 20-day resistance level.
Stop Loss: $506.80, the price-minus-1.5×ATR reference.
Advertisement
In plain English, the chart is caught between support and resistance, with neither side yet showing a clear technical advantage.
MSFT Week Ahead Data
Trading week
November 2 – November 6 (5 sessions)
Weekly change
1.67% (521.91 → 530.61 USD)
Week high / low
559.15 (November 4) / 504.96 (November 2)
Best / worst session
6.68% (November 4) / -3.58% (November 5)
Avg daily volume vs prior 20 sessions
35,001,520 vs 22,015,085 (1.59x)
SMA20 / SMA50
531.41 / 516.65
RSI (14) / Stochastic %K
51.8 / 47.3
Support / Resistance 20 days
507.12 / 555.80
3-month high / low
559.15 / 477.15
Week covered
November 9–13, 2026
Data as of
7 November 2026 04:00 WIB
Disclaimer: This technical analysis is generated automatically from exchange data and indicators calculated by JournalArta, for information and education only. The verdict and the entry, target and stop-loss levels are not investment advice or a solicitation to buy or sell any security. Investment decisions and their risks rest solely with the reader.