AVGO Stock Week Ahead (November 9–13): What Comes After a 9.93% Weekly Loss
AVGO stock week ahead for November 9–13: last close 293.69 USD, weekly change -9.93%, support 291.53, resistance 357.31.
By matthew jonathan
November 7, 20265 min read
Advertisement
Logo Broadcom — JournalArta illustration
Last Week in Review
Broadcom closed at $293.69 on Friday, November 6, after losing 9.93% over the week, according to NASDAQ data. The decline left the stock near the bottom of its weekly range: it traded between $289.77 and $335.74, then finished in the lowest 9% of that span.
The week’s strongest session was November 3, when AVGO gained 3.07%; its worst was November 5, with a 10.43% drop. Shares rose in two sessions and fell in three. Average daily volume reached 29,539,600 shares, or 1.33 times the average for the preceding 20 sessions, a sign that trading activity intensified during the sell-off.
Technical Map for the Week Ahead
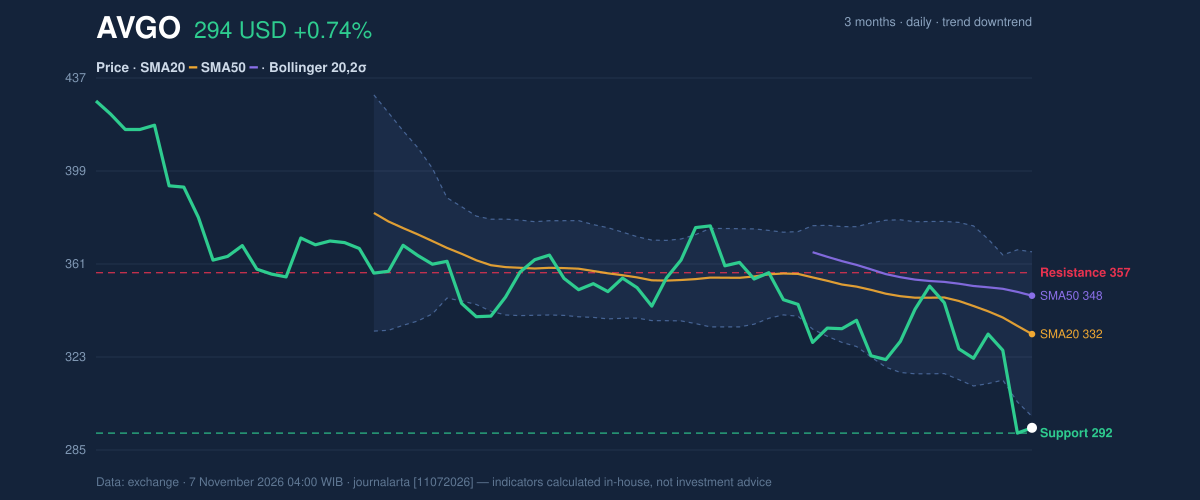
The chart enters the November 9–13 week with the stock below its key moving averages and close to established support. The 20-session support is $291.53, while resistance over that period is $357.31. The three-month range runs from $289.77 to $432.73; Friday’s close was near its lower end.
AVGO stands below its 20-day moving average of $332.12 and its 50-day average of $347.89. The 20-day average is falling at 3.93% per five days, consistent with the prevailing downtrend. The chart below shows the distance between price and those trend measures.
3-month price action chart of AVGO: price, SMA20/50, Bollinger, support & resistance.
Advertisement
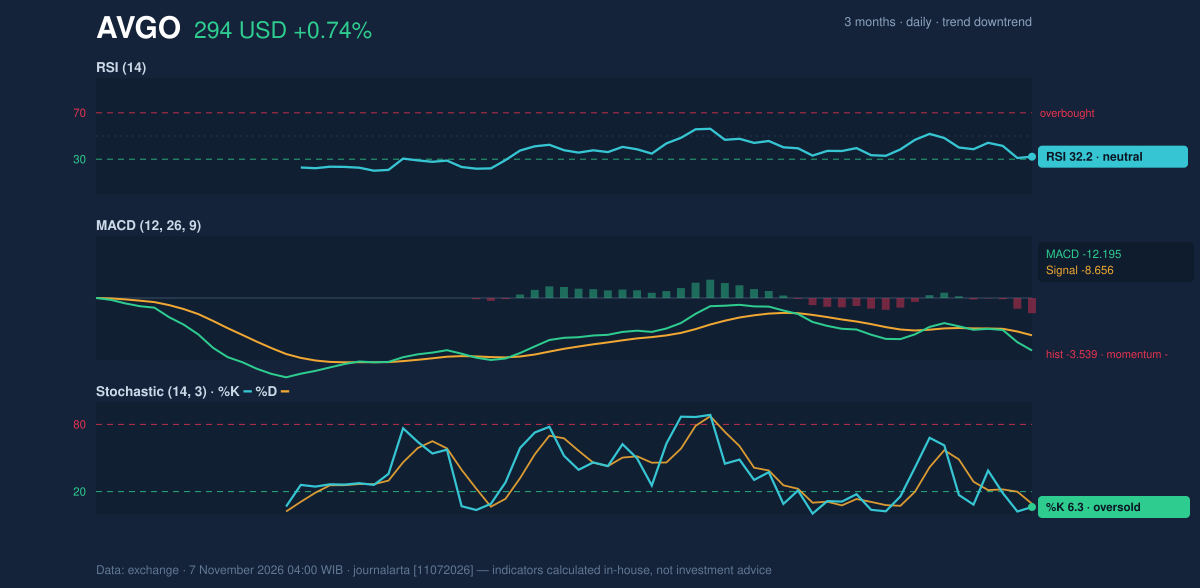
Momentum is weak but not uniformly decisive. The 14-day RSI is 32.2, classified as neutral in the supplied data, while Stochastic readings of 6.3 and 9.1 are in oversold territory. Oversold means recent selling has been unusually intense; it does not by itself establish that a rebound has begun. MACD is negative at -12.195, below its -8.656 signal line, with a -3.539 histogram. The lower Bollinger band is $298.34, above Friday’s close, and the band width of 20.3% is widening, indicating elevated volatility.
Momentum chart of AVGO: RSI(14), MACD, Stochastic.
The technical bias is NEUTRAL: the system records no bullish signals and one bearish signal, with the falling on-balance volume (OBV) confirming the downtrend. A bullish scenario would require AVGO to regain the $316.39 reference level, calculated as price plus 1.5 times ATR, and then contend with the moving-average area. A bearish scenario would be triggered by a break below $289.77, the three-month low, putting the recent floor under renewed pressure.
Advertisement
Fundamentals and Catalysts
Broadcom’s latest reported quarter showed strong year-over-year growth. In a filing published on September 10, the company reported revenue of $29.59 billion for the quarter ended August 2, up 85.5% from $15.95 billion a year earlier. Net income was $13.09 billion, compared with $4.14 billion in the year-earlier quarter, and diluted earnings per share were $2.68.
Those results provide evidence of substantial business growth, but they do not erase the short-term technical deterioration visible in the share price. Investors may weigh the company’s reported performance against the market’s sharp repricing and the risks around AI-related investment.
A notable change in positioning came on November 6. Cathie Wood’s ARK sold 410,559 Broadcom shares valued at $119.7 million, while buying $46 million of NVIDIA shares, as both chipmakers fell roughly 10% that Thursday. The transaction is a disclosed portfolio move, not proof of a broader shift in investor demand, but it adds a visible signal of changing exposure among some AI-focused investors.
Advertisement
Macro, Political and Global Factors
Political resistance to data centers over electricity, water and infrastructure strain could delay projects, according to a report published on November 6. For Broadcom, the concern matters because delays to data-center development may affect the timing of demand across the AI infrastructure market. It remains a risk to monitor rather than evidence that projects have already been cancelled.
The same November 6 report described shifting AI bets, including an ARK sale of Alphabet shares and Blackstone-backed financing involving Broadcom. Together, these developments point to changing investment and funding approaches around AI, while leaving the scale and timing of future demand uncertain.
Risks and What Would Invalidate the Scenario
The immediate risk is a break below $289.77, which would take AVGO beneath its three-month low and invalidate the bullish recovery trigger described above. A move back above $316.39 would challenge the bearish setup, though the falling 20-day average and negative MACD remain hurdles in the supplied indicators.
Volatility also cuts both ways: ATR is $15.14, equivalent to 5.2% of the share price, and the Bollinger bands are widening. The elevated volume and falling OBV reinforce the risk that selling pressure persists. Separately, data-center delays linked to political resistance and changes in AI-focused portfolio positioning could complicate expectations for demand and investment.
Advertisement
Technical Verdict for the Week: HOLD
The neutral verdict follows the supplied technical bias. Price remains below the 20-day and 50-day averages, MACD is negative, and OBV is falling; against those pressures, Stochastic is oversold and RSI remains classified as neutral. The indicators therefore show weakness without a clear, confirmed directional signal. The verdict is invalidated if price breaks below $289.77, the three-month low.
Entry Range: $289.77–$316.39, framed by the three-month low and the price-plus-1.5×ATR reference.
Target Price: $332.12, the 20-day moving average, as the first trend reference above the upper end of that range.
Stop Loss: $270.99, the price-minus-1.5×ATR reference.
In plain English, the chart does not yet provide a strong enough signal to favor either a sustained rebound or a fresh leg lower.
AVGO Week Ahead Data
Trading week
November 2 – November 6 (5 sessions)
Weekly change
-9.93% (326.08 → 293.69 USD)
Week high / low
335.74 (November 3) / 289.77 (November 6)
Best / worst session
3.07% (November 3) / -10.43% (November 5)
Avg daily volume vs prior 20 sessions
29,539,600 vs 22,223,150 (1.33x)
SMA20 / SMA50
332.12 / 347.89
RSI (14) / Stochastic %K
32.2 / 6.3
Support / Resistance 20 days
291.53 / 357.31
3-month high / low
432.73 / 289.77
Week covered
November 9–13, 2026
Data as of
7 November 2026 04:00 WIB
Disclaimer: This technical analysis is generated automatically from exchange data and indicators calculated by JournalArta, for information and education only. The verdict and the entry, target and stop-loss levels are not investment advice or a solicitation to buy or sell any security. Investment decisions and their risks rest solely with the reader.