INTC Stock Week Ahead (November 9–13): What Comes After a 14.42% Weekly Loss
INTC stock week ahead for November 9–13: last close 56.28 USD, weekly change -14.42%, support 52.25, resistance 102.81.
By matthew jonathan
November 7, 20265 min read
Advertisement
Logo Intel — JournalArta illustration
Last Week in Review
Intel fell 14.42% in the November 2–6 trading week, closing at $56.28 after ending the prior week at $65.76. The decline was sharp. Shares traded between $51.51 on November 5 and $65.72 on November 2, a 27.59% weekly range, and finished in the lower 34% of that range.
The best session was November 6, when the stock rose 7.71%; the worst was November 5, down 10.33%. Two sessions advanced and three declined. Average daily volume reached 202,622,360 shares, or 1.74 times the average for the preceding 20 sessions, indicating unusually heavy activity during the selloff and rebound.
Technical Map for the Week Ahead
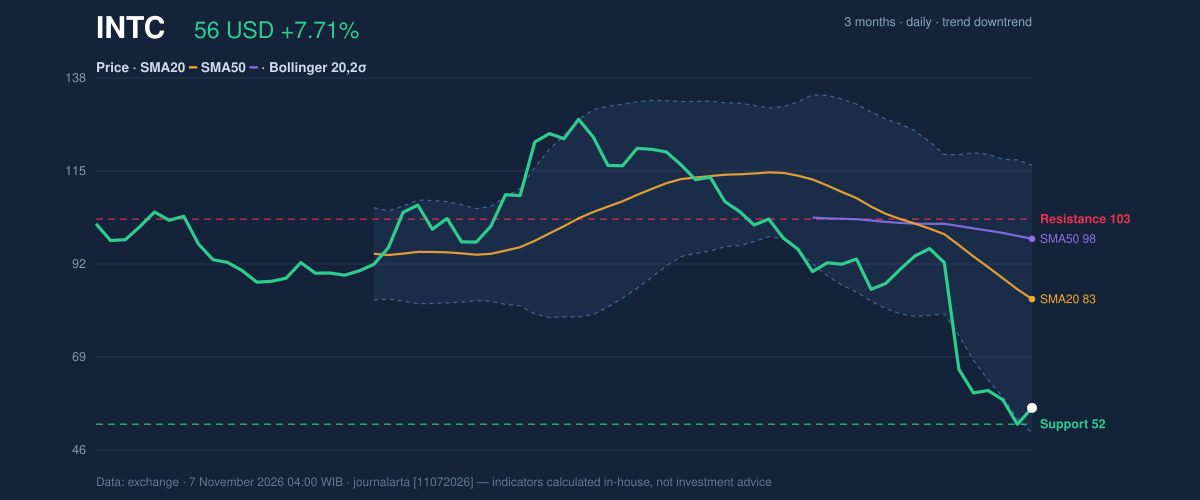
Intel enters November 9–13 in a confirmed downtrend: the 20-day moving average is sloping down 13.81% over five days, and the share price is below both the $83.08 SMA20 and the $97.95 SMA50. The 20-day support is $52.25, while 20-day resistance is $102.81. The three-month range runs from $51.51 to $127.44.
The chart shows price near the bottom of its recent range, but proximity to support is not confirmation of a reversal. The Bollinger bands—statistical bands around a moving average—are unusually wide at 79.5%, reflecting high volatility. Their middle line is $83.08, with an upper band at $116.09 and a lower band at $50.06; the %B reading is 9%, placing price close to the lower band.
3-month price action chart of INTC: price, SMA20/50, Bollinger, support & resistance.
Advertisement
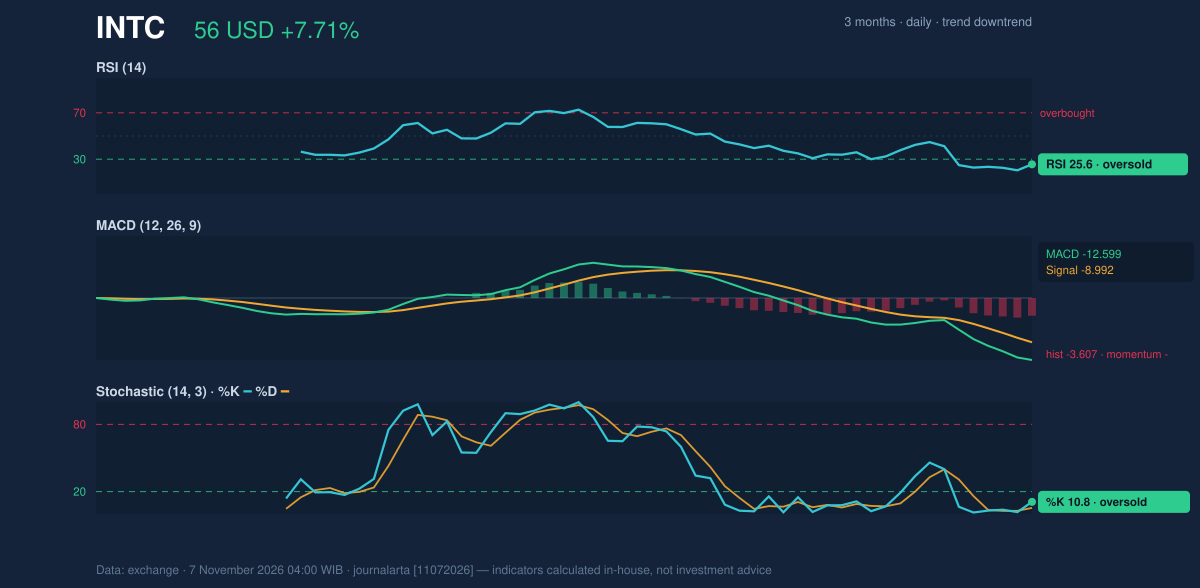
Momentum indicators remain weak. RSI, a measure of the speed and scale of recent price moves, is 25.6, in oversold territory; Stochastic readings are also oversold at %K 10.8 and %D 5.4. Oversold readings can accompany a rebound, but they do not by themselves establish that selling pressure has ended. MACD is negative at -12.599, below its -8.992 signal line, with a -3.607 histogram. OBV, which tracks whether volume is accumulating on rising or falling sessions, is declining.
Momentum chart of INTC: RSI(14), MACD, Stochastic.
Bullish scenario: A move above $66.04—the reference level calculated as price plus 1.5 times ATR—would offer an initial sign of recovery from the current area. A more substantial technical improvement would require reclaiming the $83.08 SMA20; the $102.81 20-day resistance remains a higher barrier.
Bearish scenario: A break below the $52.25 20-day support would expose the $51.51 three-month low. The DATA also gives $46.52 as price minus 1.5 times ATR, a volatility reference rather than a confirmed support level.
Advertisement
Fundamentals and Catalysts
Intel reported third-quarter 2026 revenue of $16.5 billion, up 21% year over year, with non-GAAP earnings per share of $0.52 and GAAP diluted earnings per share of $0.60, compared with $0.90 in the third quarter of 2025. Those results were reported on October 29. A separate filing reported revenue of $16.51 billion for the quarter ended September 26, up 20.9% from $13.65 billion a year earlier, and net income of $3.32 billion versus $4.06 billion a year earlier; the Form 10-Q was filed on October 30.
The contrast is material: revenue grew, while net income and GAAP earnings per share were lower than a year earlier. Intel forecast fourth-quarter 2026 revenue of $15.0 billion to $16.0 billion, with GAAP EPS of $0.10 and non-GAAP EPS of $0.25, according to information reported on October 29. That guidance provides a company-specific measure for investors to weigh against the recent volatility, without resolving the technical weakness.
Intel also said it completed a $23 billion public equity offering to support future growth opportunities and announced plans to acquire Classiq, reported on October 29. The offering is a significant financing and share-issuance fact; the supplied information does not specify further transaction terms or timing for the planned acquisition.
Advertisement
Macro, Political and Global Factors
No relevant macroeconomic, political or global facts were supplied in the research block. This analysis therefore does not attribute Intel’s move to external policy or economic developments.
Risks and What Would Invalidate the Scenario
The immediate technical risk is a break below $52.25, which would put the $51.51 three-month low in view. A deeper move toward the $46.52 ATR-based reference would extend the downside, although that level is a volatility measure, not established support. On the upside, a rise above $66.04 would challenge the near-term bearish structure, but the stock would still be below its $83.08 SMA20.
The potential for a sharp countertrend bounce is also present: RSI and Stochastic are oversold, and the November 6 gain came with average weekly volume well above its prior 20-session norm. But the MACD remains negative, OBV is falling, and the moving averages are well above the current price. The earnings context adds uncertainty: revenue growth coexists with lower year-over-year net income and GAAP EPS, while the company’s fourth-quarter forecast is below the reported third-quarter revenue figure.
Advertisement
Technical Verdict for the Week: HOLD
HOLD (wait & see) is the verdict, matching the neutral technical bias. Three signals frame that stance: RSI at 25.6 and Stochastic at 10.8 / 5.4 are oversold, but MACD at -12.599 remains below its signal line, and falling OBV confirms a downtrend signal. The neutral bias records zero of seven bullish signals and one of seven bearish signals.
- Entry range: $52.25–$66.04, bracketed by 20-day support and the price-plus-1.5×ATR reference.
- Target reference: $83.08, the SMA20.
- Stop reference: $46.52, the price-minus-1.5×ATR level.
- Invalidation: The verdict is invalidated if price breaks below $52.25, the 20-day support.
In plain English, the indicators support waiting for clearer evidence that the decline has stabilized.
INTC Week Ahead Data
Trading week
November 2 – November 6 (5 sessions)
Weekly change
-14.42% (65.76 → 56.28 USD)
Week high / low
65.72 (November 2) / 51.51 (November 5)
Best / worst session
7.71% (November 6) / -10.33% (November 5)
Avg daily volume vs prior 20 sessions
202,622,360 vs 116,380,425 (1.74x)
SMA20 / SMA50
83.08 / 97.95
RSI (14) / Stochastic %K
25.6 / 10.8
Support / Resistance 20 days
52.25 / 102.81
3-month high / low
127.44 / 51.51
Week covered
November 9–13, 2026
Data as of
7 November 2026 04:00 WIB
Disclaimer: This technical analysis is generated automatically from exchange data and indicators calculated by JournalArta, for information and education only. The verdict and the entry, target and stop-loss levels are not investment advice or a solicitation to buy or sell any security. Investment decisions and their risks rest solely with the reader.