Goldman Sachs (GS) Stock Analysis: Falls 6.36%, Testing Support Level
On November 5, 2026: price 868.95 USD, trend sideways, RSI 40.8, support 868.95, resistance 928.00. technical analysis of gs stock. Goldman Sachs — full…

Why GS is in focus today
- One-day move of -6.36%, about 2.0× its average daily range (ATR)
- Volume at 1.6× the 20-day average
- Closed at a 20-day low (868.95)
- Trading near its 3-month low (854.45)
Selected automatically from 80 NYSE (US) stocks by a technical-signal score with daily weighted randomisation — not a recommendation.
Trend & Price Action
The close sat below the 20-day simple moving average (SMA), at $895.45, and the 50-day average, at $936.01. Those averages show the stock has lost ground relative to its recent trend, though the broader pattern is classified as sideways and the 20-day average itself rose 0.13% over five days. No new moving-average crossover was recorded, so the data do not show a fresh longer-term trend signal. The immediate signal is a forceful break in price, not a confirmed change in the longer-term trend. Volume reached 3,876,400 shares, or 1.6 times its 20-day average, while on-balance volume (OBV)—a measure that tracks whether trading volume generally accompanies gains or losses—rose. That contrast suggests underlying accumulation has not disappeared, but it does not erase the significance of a high-volume close at the 20-day low. The Bollinger Bands, which frame price relative to its recent volatility, were narrowing, a condition often called a squeeze. With the close near the lower band, at $862.35, the setup can precede a larger move, but the bands do not establish its direction. The three-month low of $854.45 is the next important reference below the market.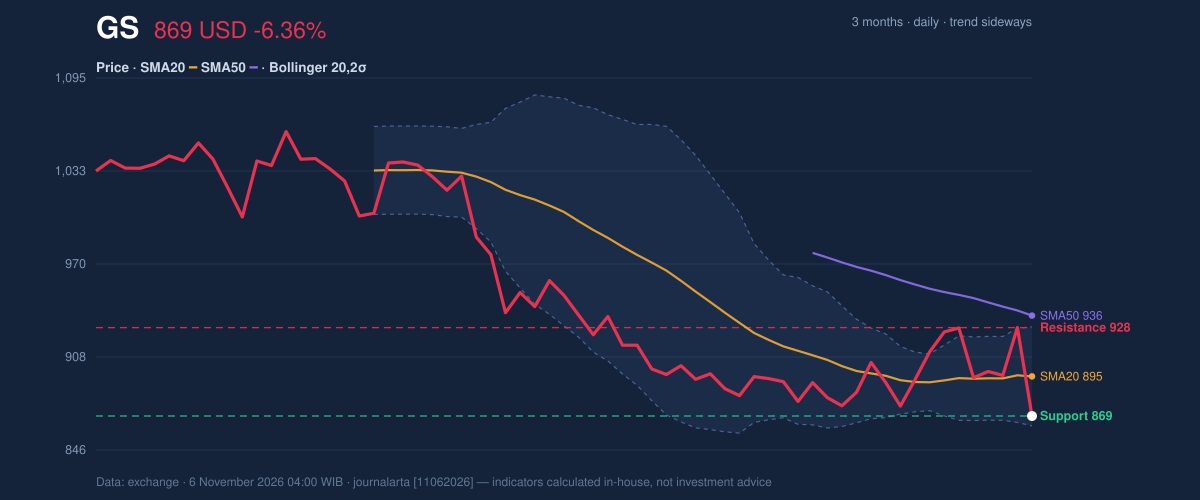
Oscillators & Momentum
Momentum readings are mixed. The RSI was 40.8, in neutral territory, rather than at a level that would independently confirm an oversold market. The Stochastic reading, which compares the latest close with its recent trading range, was oversold at 17.1 for %K, against 49.4 for %D. That gap can point to depleted near-term selling momentum, but is not by itself evidence that prices have turned. The MACD offers a modest counterpoint: its histogram was positive at 2.880, with MACD at -7.759 above the -10.640 signal line. This indicates improving momentum relative to the signal line, even though the MACD itself remained below zero. In plain terms, downward pressure may be easing, but the price has not yet reclaimed its 20-day average.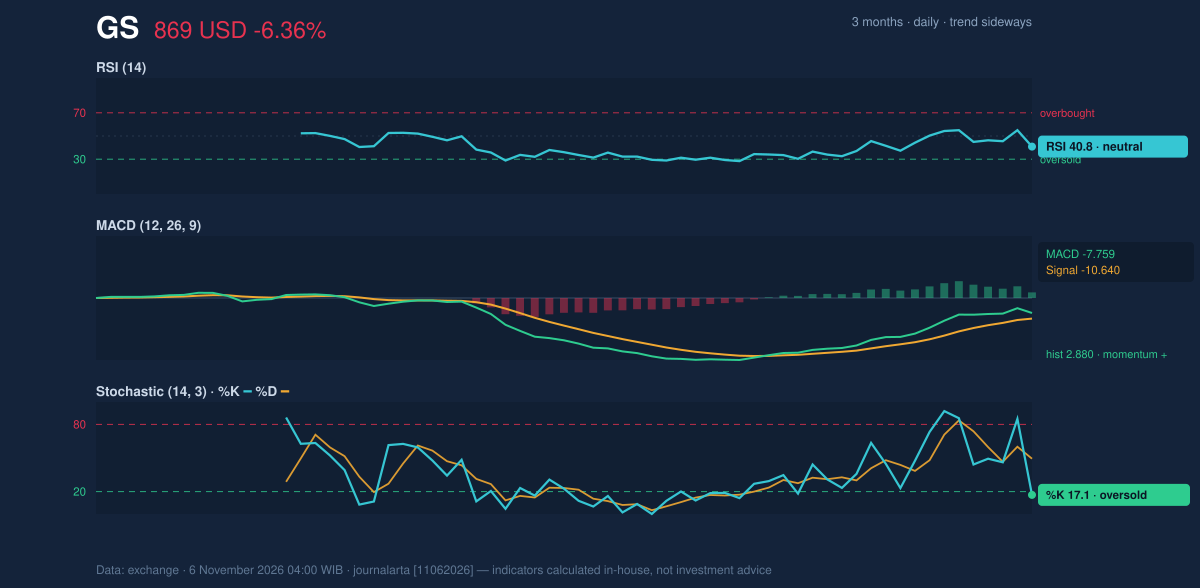
Volatility & Key Levels
The average true range (ATR), a measure of typical price movement, was $28.23, or 3.2% of the share price, indicating moderate volatility. The day’s 6.36% fall was large against that backdrop. A narrowing Bollinger Band width of 7.4% reinforces the possibility of a volatility expansion, while leaving the direction unresolved. Support is $868.95, the 20-day low, with the three-month low at $854.45. A sustained move below that lower reference would deepen the breakdown. On the upside, $928.00 is the 20-day resistance; the 20-day average at $895.45 is an intermediate hurdle. Reclaiming those levels would help show that the latest decline is being absorbed rather than extended.Fundamental Context
The technical weakness contrasts with stronger reported results. According to its SEC filing, Goldman Sachs recorded quarterly revenue of $18.68 billion for the quarter ended September 30, 2026, up 23.0% from $15.18 billion a year earlier. Net income was $5.29 billion, compared with $4.10 billion, and diluted earnings per share were $17.01. Those figures provide a firmer earnings backdrop, but do not determine whether near-term market pressure has run its course.Technical Verdict: HOLD
The technical bias is neutral: none of the seven tracked bullish signals was present, while one bearish signal was registered—the close below the 20-day low on volume at least 1.5 times average. The high-volume decline, position below both moving averages and mixed momentum readings argue against treating the oversold Stochastic reading as a confirmed reversal. The positive MACD histogram and rising OBV, however, temper the case for a clearly bearish verdict. The core signal is a neutral setup with downside pressure, but not enough confirmation to establish a sustained bearish trend. The verdict would be invalidated if price falls below $854.45, the three-month low.- Entry range: $854.45–$868.95, bounded by the three-month low and 20-day support.
- Exit target: $895.45, the 20-day average; the next resistance is $928.00.
- Stop-loss protection reference: $826.60, the price minus 1.5 times ATR.
Summary Data GS
| Last price | 868.95 USD |
| Change 1 day / 5 days / 1 month | -6.36% / -6.34% / -1.55% |
| Trend / MA-cross | sideways / none |
| SMA20 / SMA50 | 895.45 / 936.01 |
| RSI (14) / Stochastic %K | 40.8 / 17.1 |
| Bollinger %B / ATR | 10% / 28.23 |
| Support / Resistance 20 days | 868.95 / 928.00 |
| Data as of | 6 November 2026 04:00 WIB |
Disclaimer: This technical analysis is generated automatically from exchange data and indicators calculated by JournalArta, for information and education only. The verdict and the entry, target and stop-loss levels are not investment advice or a solicitation to buy or sell any security. Investment decisions and their risks rest solely with the reader.
Track GS stock price daily: live levels, support/resistance and our full GS analysis history.