AppLovin (APP) Stock on Thursday: Rises 31.04%, RSI Overbought
On November 5, 2026: price 356.10 USD, trend sideways, RSI 72.0, support 228.50, resistance 356.10. technical analysis of app stock. AppLovin — full details…
Why APP is in focus today
- One-day move of 31.04%, about 6.0× its average daily range (ATR)
- Volume at 4.3× the 20-day average
- RSI(14) at 72.0 — overbought zone
Selected automatically from 100 NASDAQ (US) stocks by a technical-signal score with daily weighted randomisation — not a recommendation.
Trend & Price Action
The one-day gain came alongside a 39.70% rise over five days and a 27.12% increase over one month. Volume reached 22,169,400 shares, against a 20-day average of 5,142,380, while On-Balance Volume (OBV)—a measure that tracks whether volume is flowing more heavily on rising or falling sessions—rose. That combination points to broad participation in the rally, rather than a price jump on unusually light trading. The price is above its 20-day moving average of $266.55, but that average is still below the 50-day average of $291.78. The 20-day average fell 1.11% over five days, and no new moving-average crossover has formed. In other words, the latest surge has strengthened short-term price action without yet reversing the slower-moving trend picture. The stock’s close also exceeded its 20-day high, a breakout signal supported here by volume well above the threshold in the technical data. But $356.10 is both the 20-day resistance and the top of the 20-day range. The three-month high, at $365.33, is the next marked ceiling; it is close enough to make follow-through important.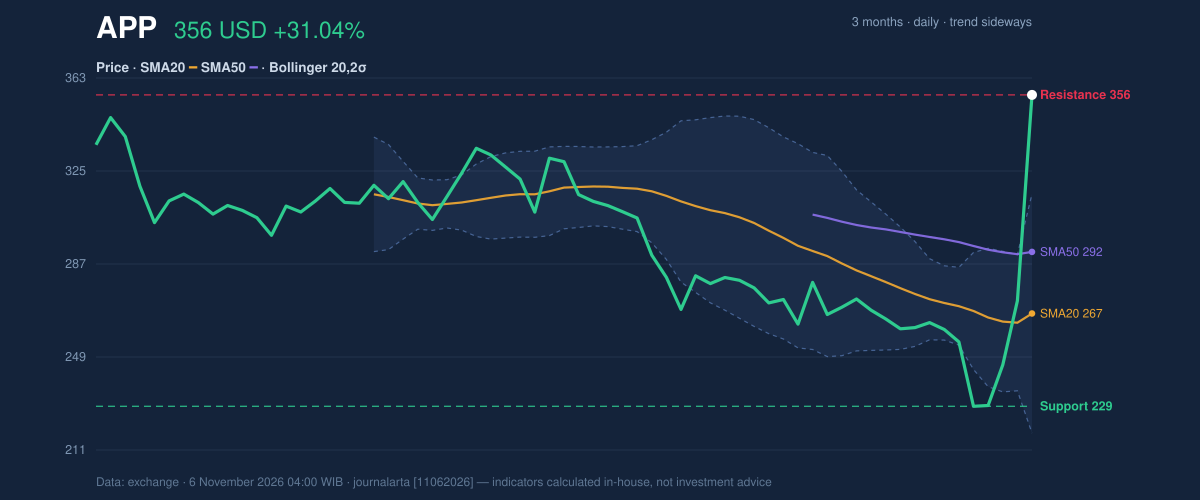
Oscillators & Momentum
AppLovin’s Relative Strength Index (RSI), which gauges the speed and size of recent price moves, is 72.0—overbought. The Stochastic readings are also stretched: %K at 93.4 and %D at 71.2. These levels describe intense upward momentum, but they also warn that the rally has advanced quickly and could be vulnerable to a pause or reversal. The Moving Average Convergence Divergence (MACD) offers a counterweight to that caution. Its histogram has turned positive at 7.590, with MACD at -3.078 above its signal line at -10.668. A positive histogram indicates that upward momentum is improving, even though the MACD value itself remains below zero. The technical screen classifies the overall bias as bullish, with three bullish signals and no bearish signals, including the positive MACD histogram and the high-volume close above the 20-day high.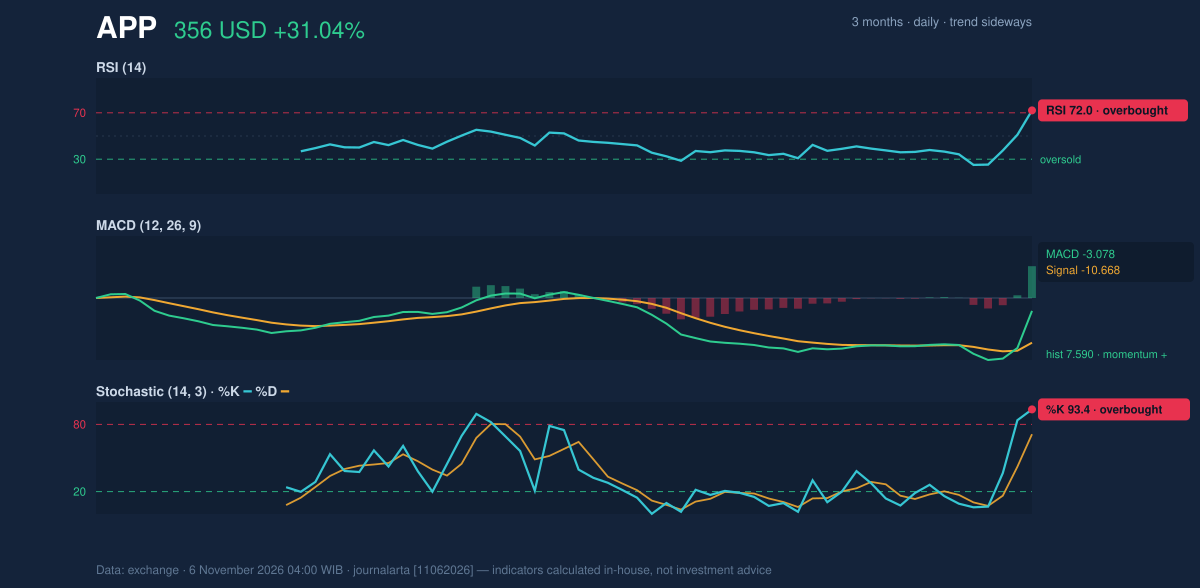
Volatility & Key Levels
The Bollinger Bands, which frame a recent price range using volatility, have widened to 36.8%. AppLovin’s %B reading of 141% places the price above the upper band of $315.57; the middle band is $266.55 and the lower band is $217.53. A reading above 100% signals that price has pushed beyond the band, consistent with an unusually forceful move but also with heightened volatility. The 14-day Average True Range is $18.33, or 5.1% of the price. The day’s 31.04% gain was about six times that typical daily range, underscoring how far the stock moved relative to its recent trading pattern. The specified price-minus-1.5-ATR reference is $328.61, while the corresponding upside reference is $383.59; these are volatility-based levels, not forecasts. The nearest technical hurdle is the three-month high at $365.33. A sustained break above it would put the $383.59 volatility reference in view as a conditional level. If the price retreats, $328.61 is the closer volatility-based reference, while the broader 20-day support is $228.50. The three-month low is $225.19.Fundamental Context
According to its SEC filing, AppLovin reported quarterly revenue of $2.18 billion for the quarter ended September 30, 2026, up 55.5% from $1.41 billion a year earlier. Net income was $1.44 billion, compared with $835.5 million, and diluted earnings per share were $4.30. The filing provides a strong earnings backdrop, but the verdict below follows the stated technical signals.Technical Verdict: BUY
The bullish verdict matches the technical bias: the price closed above the 20-day high on heavy volume, OBV rose, and the MACD histogram turned positive. The main counter-signals are overbought RSI at 72.0 and Stochastic %K at 93.4, alongside a volatility surge that leaves the stock extended above its upper Bollinger Band. - Ideal entry range: $328.61–$356.10, using the price-minus-1.5-ATR reference and 20-day resistance as boundaries. - Exit target: $365.33, the next resistance at the three-month high. - Stop-loss protection: $228.50, below the 20-day support. - Invalidation: The bullish verdict is invalidated if the price falls below $228.50. For non-traders, the signals currently favor continued strength, but the unusually sharp rise makes a pullback a material risk.Summary Data APP
| Last price | 356.10 USD |
| Change 1 day / 5 days / 1 month | 31.04% / 39.70% / 27.12% |
| Trend / MA-cross | sideways / none |
| SMA20 / SMA50 | 266.55 / 291.78 |
| RSI (14) / Stochastic %K | 72.0 / 93.4 |
| Bollinger %B / ATR | 141% / 18.33 |
| Support / Resistance 20 days | 228.50 / 356.10 |
| Data as of | 6 November 2026 04:00 WIB |
Disclaimer: This technical analysis is generated automatically from exchange data and indicators calculated by JournalArta, for information and education only. The verdict and the entry, target and stop-loss levels are not investment advice or a solicitation to buy or sell any security. Investment decisions and their risks rest solely with the reader.
Track APP stock price daily: live levels, support/resistance and our full APP analysis history.