Emerson Electric (EMR) Stock Falls 4.59% on Thursday, Testing Support Level
On November 5, 2026: price 162.61 USD, trend sideways, RSI 49.9, support 160.29, resistance 170.74. technical analysis of emr stock. Emerson Electric — full…

Why EMR is in focus today
- One-day move of -4.59%, about 1.3× its average daily range (ATR)
- Volume at 1.9× the 20-day average
- MACD histogram has just turned negative
- Not covered by JournalArta in the last 14 days
Selected automatically from 80 NYSE (US) stocks by a technical-signal score with daily weighted randomisation — not a recommendation.
Trend & Price Action
The latest close was below the 20-day moving average of $163.76 but above the 50-day average of $157.81. That places the shares in a short-term pullback within a broader price structure that has not yet broken below the longer average. The 20-day average itself rose 0.82% over five days, a sign the recent weakness has not erased its mild upward slope. No new moving-average crossover was recorded. The share price sits in the lower portion of its recent range: 22% of the way from the 20-day support at $160.29 to resistance at $170.74. Its 3-month range runs from $144.40 to $172.00. A close below the 20-day average therefore signals pressure, but the nearby support and higher 50-day average are important tests before calling the broader structure broken.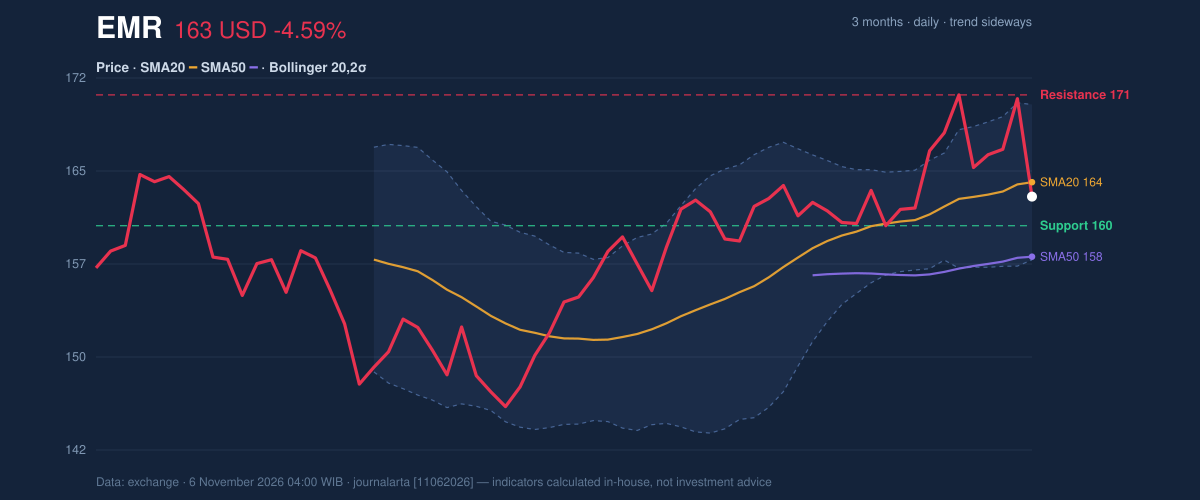
Oscillators & Momentum
Momentum indicators do not yet show a decisive washout or rebound. RSI was 49.9, a neutral reading around the midpoint of its scale, while Stochastic %K at 46.3 and %D at 69.4 were also classified as neutral. The technical bias flags RSI rolling over from above 65, which points to fading momentum even though its current level is not extreme. MACD was 2.305 against a signal line of 2.349, leaving its histogram at -0.044. The histogram has just turned negative, a bearish shift in momentum rather than proof of a full trend reversal. This is one of the clearest reasons for caution after the high-volume decline. The indicators’ mixed readings fit a neutral bias: the pullback is real, but the price remains above the 50-day average.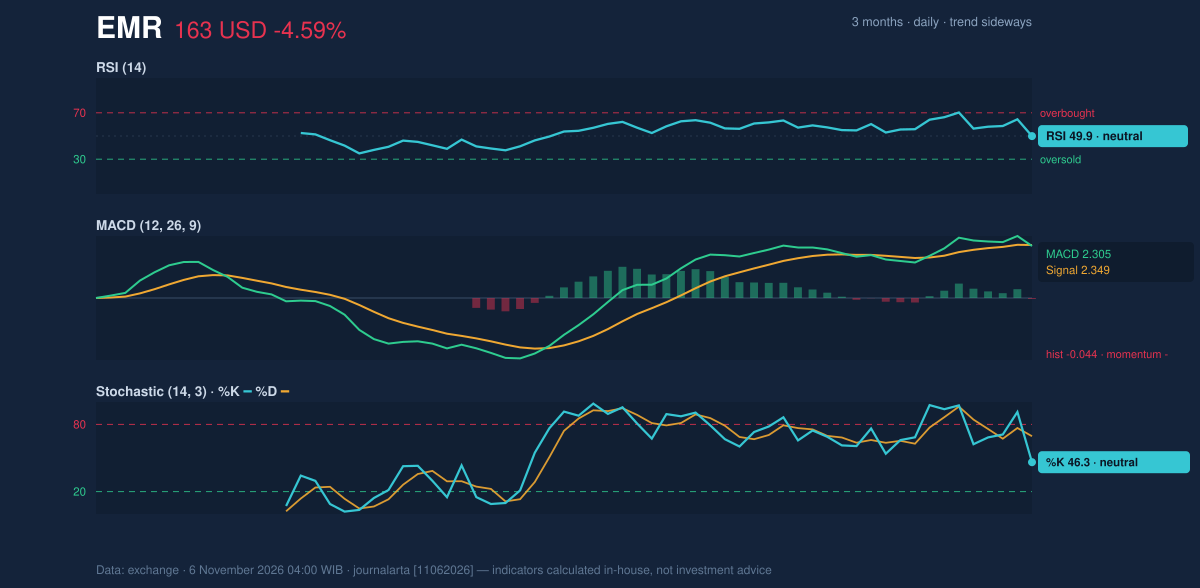
Volatility & Key Levels
The Bollinger Bands are narrowing, with a 7.6% band width, while the price sits at 41% of the range between the lower and upper bands. A squeeze means recent price variation has contracted; it can precede a larger move, but does not indicate its direction. The latest decline may be testing the lower part of the structure, though price remains above the lower band at $157.55. ATR was $5.59, or 3.4% of the share price, indicating moderate volatility. Support at $160.29 is the immediate level to watch; a break below it would expose the lower Bollinger Band at $157.55 and the 50-day average at $157.81. On the upside, the 20-day resistance at $170.74 sits just below the 3-month high of $172.00. A move through that area would be needed to show buyers have reclaimed the recent range. The ATR-based reference levels are $154.23 below and $170.99 above, underscoring how far a typical volatility-adjusted move could extend.Fundamental Context
According to its SEC filing, Emerson reported quarterly revenue of $4.87 billion for the quarter ended June 30, 2026, up 7.0% from $4.55 billion a year earlier. Net income was $718.0 million, compared with $586.0 million, and diluted earnings per share were $1.28. The company filed a Form 8-K on November 4 reporting results of operations and financial condition. These results provide a firmer operating backdrop, but the near-term verdict here remains driven by price and momentum signals.Technical Verdict: HOLD
The neutral technical bias supports HOLD: price is below the 20-day average, MACD momentum has turned negative, but the shares remain above the 50-day average and OBV is rising. The verdict is invalidated if price falls below the 20-day support at $160.29, which would weaken the current case that the pullback is contained. - Ideal entry range: $157.55–$160.29, the lower Bollinger Band to 20-day support zone. - Exit target: $170.74, the 20-day resistance. - Stop-loss protection: $154.23, the price-minus-1.5-ATR reference level. In plain English, the signals are mixed, so the chart does not yet show a clear direction.Summary Data EMR
| Last price | 162.61 USD |
| Change 1 day / 5 days / 1 month | -4.59% / -4.76% / 2.23% |
| Trend / MA-cross | sideways / none |
| SMA20 / SMA50 | 163.76 / 157.81 |
| RSI (14) / Stochastic %K | 49.9 / 46.3 |
| Bollinger %B / ATR | 41% / 5.59 |
| Support / Resistance 20 days | 160.29 / 170.74 |
| Data as of | 6 November 2026 04:00 WIB |
Disclaimer: This technical analysis is generated automatically from exchange data and indicators calculated by JournalArta, for information and education only. The verdict and the entry, target and stop-loss levels are not investment advice or a solicitation to buy or sell any security. Investment decisions and their risks rest solely with the reader.
Track EMR stock price daily: live levels, support/resistance and our full EMR analysis history.