Ross Stores (ROST) Stock Falls 4.28%, Golden Cross Formed In Focus
On November 5, 2026: price 235.23 USD, trend uptrend, RSI 52.1, support 222.41, resistance 245.74. technical analysis of rost stock. Ross Stores — full details…

Why ROST is in focus today
- One-day move of -4.28%, about 1.4× its average daily range (ATR)
- Fresh golden cross: SMA20 crossed above SMA50
- Uptrend confirmed (5-day change 1.26%)
Selected automatically from 100 NASDAQ (US) stocks by a technical-signal score with daily weighted randomisation — not a recommendation.
Trend & Price Action
The shares closed above the 20-day simple moving average (SMA) of $232.41 and the 50-day average of $230.87. The 20-day average rose 0.90% over five days, while the SMA20 crossed above the SMA50 two sessions before the latest session. This “golden cross” is a sign that shorter-term price momentum has improved relative to the medium-term trend, though it does not guarantee that gains will continue. The pullback has brought the price closer to the 20-day average without pushing it below. That matters: a hold above the average would be consistent with a routine pause within an uptrend, while a sustained move below it would weaken that reading. The stock sits at 55% of its 20-day range, between support at $222.41 and resistance at $245.74. Its three-month range extends from $220.10 to $256.45. The Bollinger Bands, which track price relative to a moving average and recent volatility, are at $221.96 on the lower side and $242.86 on the upper side. At 63% of the band width, the share price is in the upper half of the range, but not pressed against the upper boundary. The band width is normal at 9.0%, suggesting neither an unusually compressed setup nor a pronounced volatility expansion.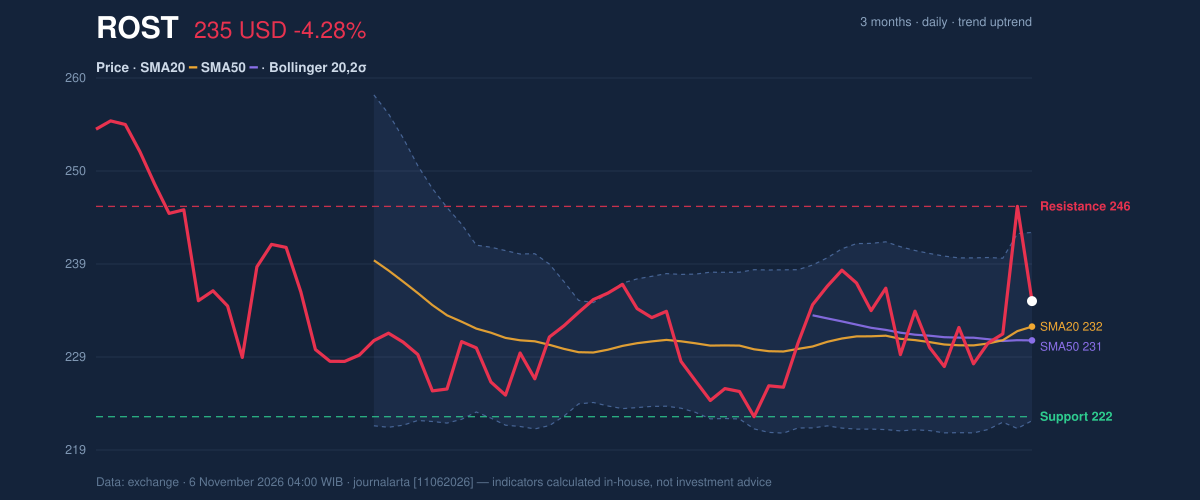
Oscillators & Momentum
Momentum readings are mixed but not strongly negative. The RSI is neutral at 52.1; the Relative Strength Index compares the pace of recent gains with losses, and this reading points to neither an overbought nor an oversold market. The Stochastic is also neutral, with %K at 41.4 and %D at 55.5. Its lower %K reading shows weaker near-term momentum than the comparison line, a caution after the steep daily decline, but not by itself a reversal signal. The MACD remains positive: its reading is 0.984 against a signal line of 0.256, leaving a positive histogram of 0.728. MACD compares shorter- and longer-term price momentum; a positive histogram indicates that the faster measure remains above its signal line. Alongside the recent golden cross, it supports the bullish technical bias, even as the neutral oscillators argue against treating the pullback as already resolved.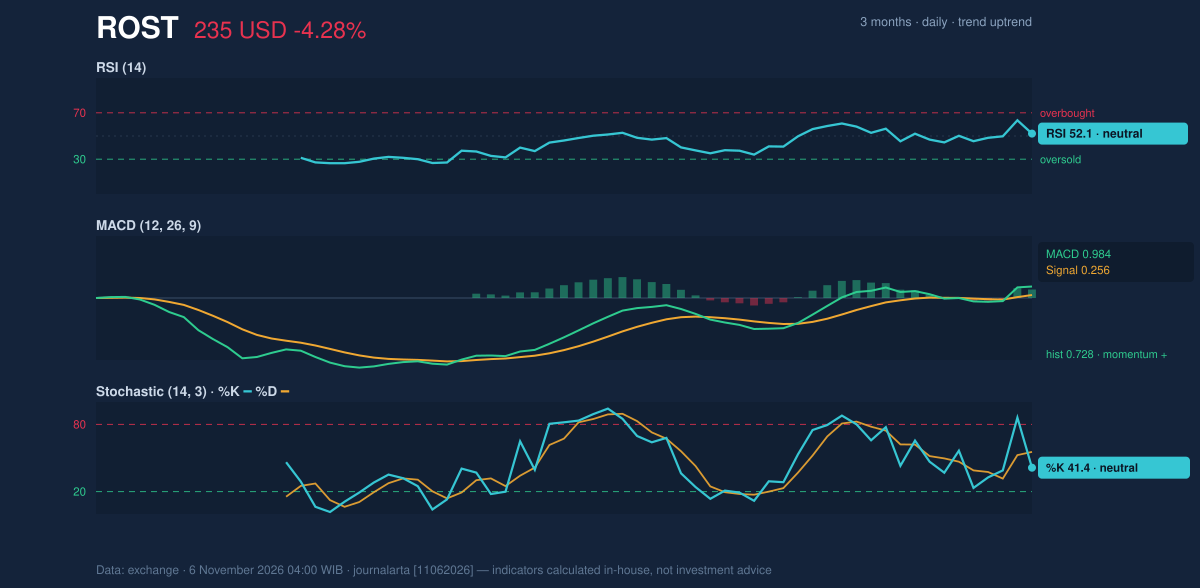
Volatility, Volume & Levels
Trading volume reached 3,104,700 shares, compared with a 20-day average of 2,181,315. The heavier activity gives the decline more significance than a low-volume retreat, but rising On-Balance Volume (OBV)—a running measure that relates volume to price direction—suggests broader participation has not yet turned decisively negative. The contrast is important: sellers were active in the latest session, while the longer-running volume signal still points upward. A move back toward $245.74 would bring the 20-day resistance into focus; above that, the three-month high at $256.45 is the next reference level. On the downside, the 20-day support at $222.41 is close to the three-month low of $220.10. A failure to hold that support would challenge the uptrend, while a hold above the SMA20 at $232.41 would preserve a nearer-term sign of resilience.Fundamental Context
According to its SEC filing, Ross Stores reported quarterly revenue of $6.26 billion for the quarter ended August 1, 2026, up 13.3% from $5.53 billion a year earlier. Net income was $851.3 million, compared with $508.0 million a year earlier, and diluted earnings per share were $2.66. Those results provide a stronger operating backdrop, but the verdict below is based on the technical signals.Technical Verdict: BUY
The technical bias is bullish, with four of seven signals pointing higher and none classified as bearish. The main supports are the golden cross formed two sessions earlier, positive MACD momentum, and an uptrend supported by rising OBV. The neutral RSI and Stochastic, plus the above-average volume accompanying the drop, remain reasons to watch whether support holds. - Ideal entry range: $232.41–$235.23, anchored to the 20-day SMA and latest close. - Exit target: $245.74, the 20-day resistance. - Stop-loss protection: $222.41, the 20-day support. - Invalidation: The bullish verdict is invalidated if the price falls below $222.41. In plain English, the chart still favors a rising trend, but a break below support would undermine that reading.Summary Data ROST
| Last price | 235.23 USD |
| Change 1 day / 5 days / 1 month | -4.28% / 1.26% / 4.45% |
| Trend / MA-cross | uptrend / golden |
| SMA20 / SMA50 | 232.41 / 230.87 |
| RSI (14) / Stochastic %K | 52.1 / 41.4 |
| Bollinger %B / ATR | 63% / 7.34 |
| Support / Resistance 20 days | 222.41 / 245.74 |
| Data as of | 6 November 2026 04:00 WIB |
Disclaimer: This technical analysis is generated automatically from exchange data and indicators calculated by JournalArta, for information and education only. The verdict and the entry, target and stop-loss levels are not investment advice or a solicitation to buy or sell any security. Investment decisions and their risks rest solely with the reader.
Track ROST stock price daily: live levels, support/resistance and our full ROST analysis history.