Oracle (ORCL) Stock Falls 6.93% (November 5, 2026): Testing Support Level
On November 5, 2026: price 115.16 USD, trend downtrend, RSI 37.7, support 115.16, resistance 144.54. technical analysis of orcl stock. Oracle — full details…

Oracle closed at its lowest level in twenty trading days on Thursday, November 5, as a steep weekly decline and rising trading volume put the cloud and software company’s shares under pressure. The stock fell 6.93% in one day to $115.16 and was down 17.48% over five days, leaving investors weighing a sharp technical deterioration against the company’s recent revenue growth.
Why ORCL is in focus today
- Closed at a 20-day low (115.16)
- Downtrend extending (5-day change -17.48%)
Selected automatically from 80 NYSE (US) stocks by a technical-signal score with daily weighted randomisation — not a recommendation.
Trend & Price Action
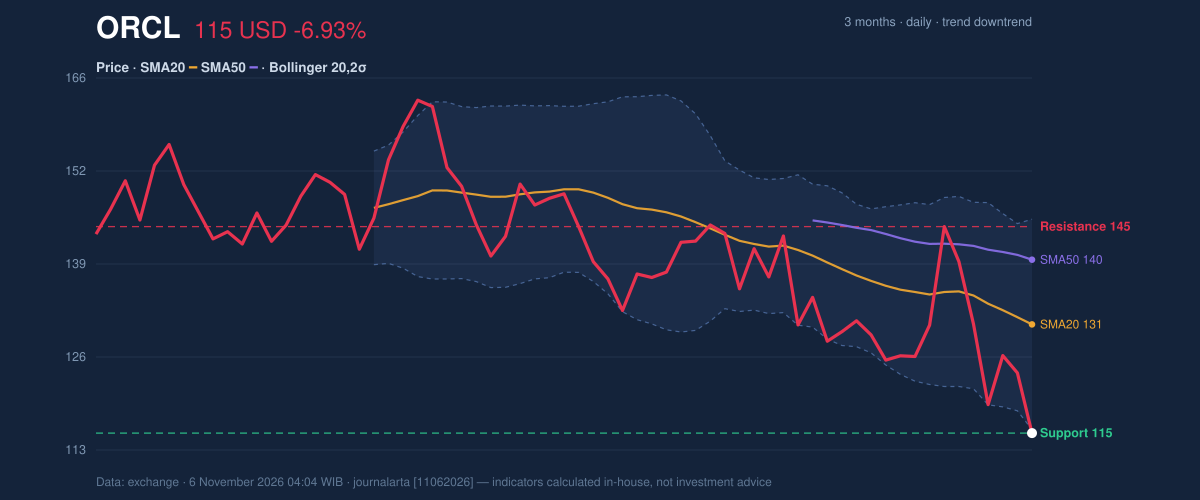
The shares are below both the 20-day simple moving average (SMA) of $130.62 and the 50-day average of $139.83. The 20-day average itself fell 3.47% over five days, a sign that weakness is not confined to a single session. No new moving-average crossover has formed, but the price’s position below both averages leaves the prevailing trend down.
The latest close also sat at the twenty-day support level of $115.16, at the bottom of the recent range. That makes the area a key test: holding it could steady the price, while a break would put the three-month low of $111.66 in view. The stock is still above that longer-period low, but the margin is narrow.
The chart shows how far the price has moved below its averages.
Oscillators & Momentum
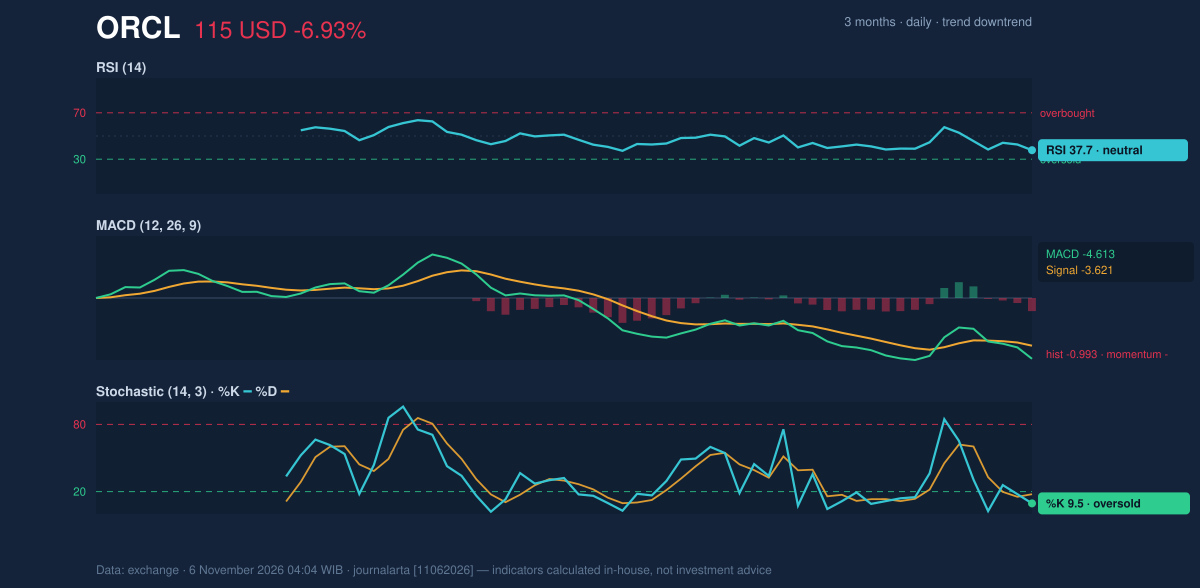
Momentum indicators are weak, though they do not all tell the same story. The MACD is negative at -4.613, below its -3.621 signal line, while its negative histogram indicates downside momentum remains in place. The Stochastic is oversold, with %K at 9.5 and %D at 17.7; that can signal that selling has become stretched, but it does not by itself confirm a reversal. The RSI is 37.7, in neutral territory, rather than at an extreme that would settle the question.
The indicators point to pressure, not proof of a rebound.
Volatility & Volume
Oracle’s price finished just below the lower Bollinger Band, with %B at -2%. Bollinger Bands compare price with a moving average and widen when price swings increase; here, the band width of 22.9% is expanding, consistent with heightened volatility rather than a settled trading range. The average true range, a measure of typical price movement, was $8.37, or 7.3% of the share price, underlining the scale of recent daily swings.
Trading volume reached 56,591,200 shares, or 1.3 times the 20-day average. Above-average activity during a decline suggests heavier participation in the selling. The falling On-Balance Volume (OBV), which tracks whether volume is flowing more with rising or falling sessions, reinforces that concern. The dataset’s technical bias remains neutral overall, with zero of seven bullish signals and one of seven bearish signals; that bearish signal is the downtrend confirmed by falling OBV.
Fundamental Context
According to its SEC filing, Oracle reported quarterly revenue of $19.35 billion for the quarter ended August 31, 2026, up 29.6% from $14.93 billion a year earlier. Net income was $4.76 billion, compared with $2.93 billion a year earlier, and diluted earnings per share were $1.56. Those results provide a counterpoint to the share-price weakness, but the technical verdict below is based on the trading indicators. Oracle also filed an 8-K with the SEC on November 4 reporting other material events.
Technical Verdict: HOLD (wait & see)
HOLD (wait & see) matches the dataset’s neutral technical bias: the price is under both moving averages, MACD momentum is negative, and falling OBV confirms the downtrend. At the same time, the Stochastic is oversold and the price is testing twenty-day support, leaving room for a short-term bounce without confirming one. The verdict is invalidated if price falls below $115.16, the twenty-day support level.
- Illustrative entry range: $115.16–$127.72, spanning twenty-day support to the data-defined price-plus-1.5-ATR reference level.
- Illustrative exit target: $144.54, the twenty-day resistance level.
- Illustrative stop-loss protection: $102.60, the price-minus-1.5-ATR reference level.
In plain English, the indicators show a weak trend at support, but not enough agreement to confirm either a durable recovery or a decisive further breakdown.
Summary Data ORCL
| Last price | 115.16 USD |
| Change 1 day / 5 days / 1 month | -6.93% / -17.48% / -15.13% |
| Trend / MA-cross | downtrend / none |
| SMA20 / SMA50 | 130.62 / 139.83 |
| RSI (14) / Stochastic %K | 37.7 / 9.5 |
| Bollinger %B / ATR | -2% / 8.37 |
| Support / Resistance 20 days | 115.16 / 144.54 |
| Data as of | 6 November 2026 04:04 WIB |
Disclaimer: This technical analysis is generated automatically from exchange data and indicators calculated by JournalArta, for information and education only. The verdict and the entry, target and stop-loss levels are not investment advice or a solicitation to buy or sell any security. Investment decisions and their risks rest solely with the reader.
Track ORCL stock price daily: live levels, support/resistance and our full ORCL analysis history.