AbbVie (ABBV) Stock Falls 2.24%, Momentum Weakens In Focus
On November 5, 2026: price 288.24 USD, trend uptrend, RSI 57.3, support 274.36, resistance 294.89. technical analysis of abbv stock. AbbVie — full details here.
By matthew jonathan
November 6, 20264 min read
Advertisement
Logo AbbVie — JournalArta illustration
AbbVie shares fell 2.24% to $288.24 on Thursday, November 5, even as the drugmaker’s latest quarterly filing showed revenue growth and a sharp rise in net income. The pullback leaves the stock above its 20-day and 50-day averages, but weakening momentum and a negative MACD reading keep the technical picture balanced rather than decisively bullish.
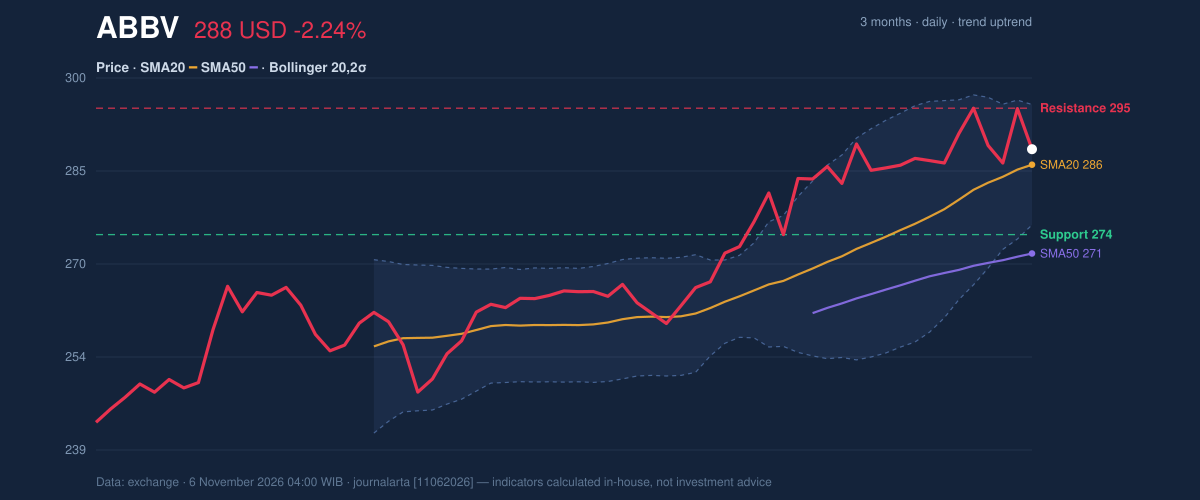
The session’s 2.24% decline came after a 5.81% gain over the past month; shares were down 0.88% over five days. At $288.24, the stock remains above its 20-day average of $285.72 and its 50-day average of $271.29, a structure consistent with an existing uptrend. The 20-day average rose 2.03% over five days, indicating the short-term trendline is still climbing despite the latest retreat. No new moving-average crossover has formed.
The retreat has not broken the trend. But it has weakened the case for an immediate continuation higher.
Trend & Price Action
AbbVie sits in the upper portion of its recent trading range, at 68% of the 20-day range between support at $274.36 and resistance at $294.89. That position suggests buyers have maintained ground, though the stock is approaching a level where recent advances have met resistance. Its three-month high is $302.93, while the three-month low is $241.20.
The Bollinger Bands—an indicator that places a range around the moving average—are narrowing, with the price at 63% of the band’s width. The 6.8% band width signals a squeeze, meaning recent price swings have compressed and a larger move may follow, but it does not identify the direction. The upper and lower bands stand at $295.50 and $275.94, respectively. As shown in the chart, those boundaries frame the near-term range alongside the moving averages and key support and resistance.
3-month price action chart of ABBV: price, SMA20/50, Bollinger, support & resistance.
Advertisement
Oscillators & Momentum
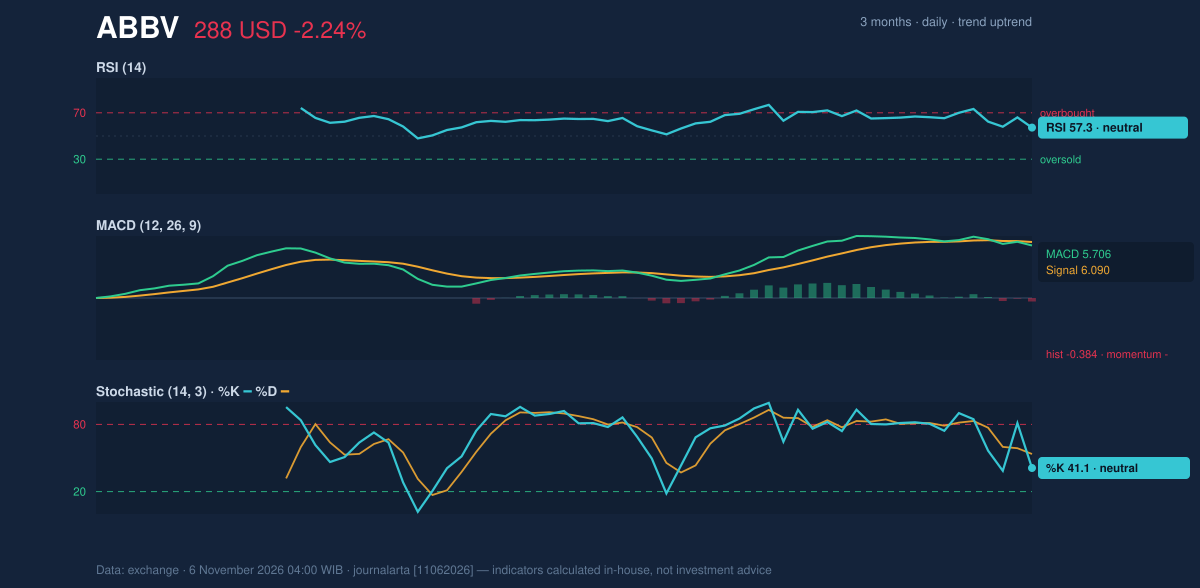
Momentum readings are mixed. The RSI is 57.3, a neutral reading, while the Stochastic %K at 41.1 and %D at 53.6 also sit in neutral territory. RSI measures the pace of recent gains and losses; the Stochastic compares a closing price with its recent range. Neither currently signals an extreme, but the data indicate RSI has rolled over from above 65, a sign that upward momentum has cooled.
MACD momentum has turned negative: its histogram is -0.384, with MACD at 5.706 below the 6.090 signal line. MACD compares moving averages to gauge whether momentum is strengthening or fading. The reading points to near-term weakness, though it is not, by itself, evidence that the broader uptrend has ended.
Momentum chart of ABBV: RSI(14), MACD, Stochastic.
Volatility, Volume & Levels
Average true range, which estimates typical price movement, is $7.59, or 2.6% of the share price—moderate volatility by the figures provided. Volume reached 7,967,200 shares, about 1.4 times the 20-day average of 5,629,735. On-balance volume is rising, suggesting buying participation has supported the broader trend even as the latest session turned lower.
The level to watch immediately is resistance at $294.89, close to the upper Bollinger Band at $295.50. A move through that area would put the three-month high of $302.93 in focus. If the stock fails to hold the 20-day average at $285.72, support at $274.36 becomes more consequential; the lower Bollinger Band at $275.94 is nearby. These levels outline where the current balance could shift, rather than guaranteeing a breakout or breakdown.
Advertisement
Company Results & Filing Context
According to its SEC filing, AbbVie reported quarterly revenue of $17.40 billion for the quarter ended September 30, 2026, up 10.3% from $15.78 billion a year earlier. Net income was $4.22 billion, compared with $186.0 million a year earlier, and diluted earnings per share were $2.37. The company also filed an 8-K on November 2 reporting a change of directors or officers. The operating results provide fundamental context, but they do not erase the short-term divergence between rising volume-based accumulation and weakening momentum indicators.
Technical Verdict: HOLD
The neutral technical bias supports a wait-and-see stance. The uptrend remains intact with the share price above both the 20-day and 50-day averages, and rising OBV confirms participation. Against that, the negative MACD histogram and RSI rolling over from above 65 signal fading momentum. The verdict is invalidated if the price falls below $274.36, the 20-day support.
- Entry range: $285.72–$294.89, between the 20-day average and 20-day resistance.
- Exit target: $294.89, the 20-day resistance; a move above it would bring the $302.93 three-month high into view.
- Stop-loss protection: Below $274.36, the 20-day support.
In plain English, AbbVie’s longer-term price structure still looks firm, but short-term signals are too mixed to confirm the next move. The latest SEC filing shows quarterly revenue of $17.40 billion, while the chart’s next test is resistance at $294.89.
Advertisement
Summary Data ABBV
Last price
288.24 USD
Change 1 day / 5 days / 1 month
-2.24% / -0.88% / 5.81%
Trend / MA-cross
uptrend / none
SMA20 / SMA50
285.72 / 271.29
RSI (14) / Stochastic %K
57.3 / 41.1
Bollinger %B / ATR
63% / 7.59
Support / Resistance 20 days
274.36 / 294.89
Data as of
6 November 2026 04:00 WIB
Disclaimer: This technical analysis is generated automatically from exchange data and indicators calculated by JournalArta, for information and education only. The verdict and the entry, target and stop-loss levels are not investment advice or a solicitation to buy or sell any security. Investment decisions and their risks rest solely with the reader.