Arm Stock Technicals: Falls 13.08% on Thursday, RSI Oversold
On November 5, 2026: price 166.72 USD, trend downtrend, RSI 26.9, support 166.72, resistance 266.28. technical analysis of arm stock. Arm Stock Technicals —…

Why ARM is in focus today
- One-day move of -13.08%, about 1.5× its average daily range (ATR)
- Volume at 2.7× the 20-day average
- Closed at a 20-day low (166.72)
- RSI(14) at 26.9 — oversold zone
- Downtrend extending (5-day change -27.12%)
Selected automatically from 100 NASDAQ (US) stocks by a technical-signal score with daily weighted randomisation — not a recommendation.
Trend & Price Action
The fall extended a steep slide: Arm lost 27.12% over five days and 39.44% over one month. Its price is below both the 20-day simple moving average (SMA), at $223.10, and the 50-day SMA, at $254.39. The 20-day average itself fell 10.42% over five days, reinforcing that the weakness is not confined to a single session. No new moving-average crossover was recorded. At $166.72, the stock closed at its 20-day low and at the bottom of its stated 20-day range. The 20-day support is therefore under immediate pressure; the three-month low of $163.13 is the next reference below it. A break through that longer-period low would mark a further deterioration in price structure, while a bounce would still need to contend with the downward-sloping average and overhead resistance. As shown in the chart, price sits below the lower Bollinger Band, a position that can accompany intense selling but is not, by itself, evidence that a rebound is imminent.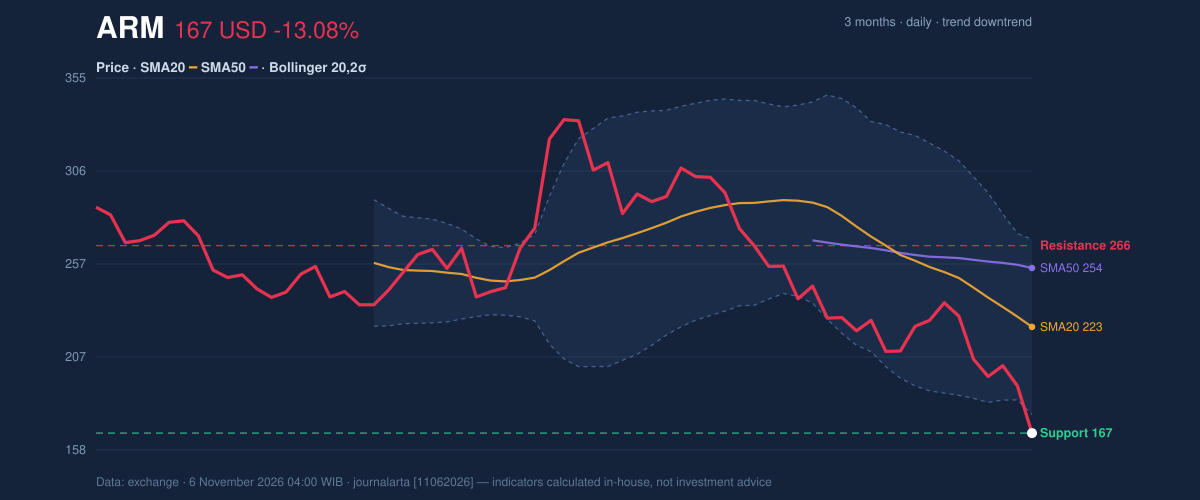
Momentum & Volatility
The RSI, or Relative Strength Index, is 26.9, in oversold territory. The Stochastic oscillator is also deeply stretched, with %K at 4.8 and %D at 7.2. These readings mean recent losses have been unusually forceful relative to the indicators’ look-back periods. They can precede a pause or rebound, but in a persistent downtrend, oversold conditions can last. The MACD remains negative: -20.925 versus a -16.644 signal line, with a -4.281 histogram. That configuration indicates downward momentum is still dominant, rather than showing a confirmed turn. The chart brings these signals together: oversold readings are a counterweight to the continuing negative MACD, not a replacement for it.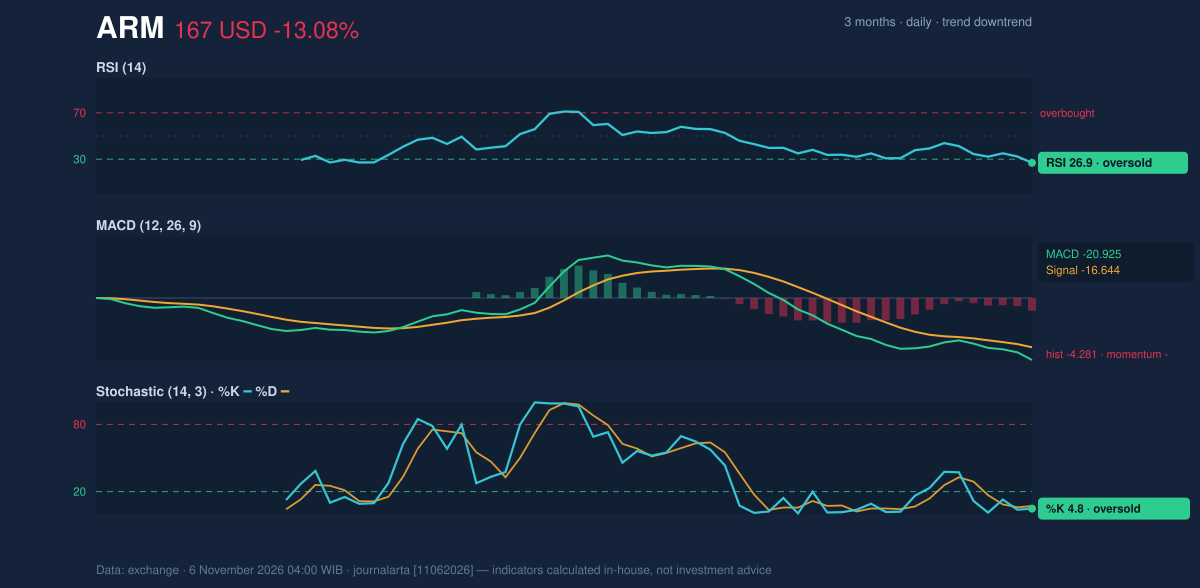
Key Levels & Scenarios
The immediate test is $166.72 support, with the $163.13 three-month low just below. If price fails to hold that lower reference, the technical picture would weaken further. The data’s ATR-based reference at $145.53 illustrates the potential scale of movement under high volatility; it is a calculated level, not a forecast. On a recovery, the $187.91 ATR-based level comes before the 20-day average at $223.10. The stated 20-day resistance is $266.28, while the three-month high is $336.98. Those levels provide context for the distance price would need to cover before the broader downtrend could be questioned; a short-term bounce alone would not erase the falling averages or weak OBV.Fundamental Context
The latest filing shows a mixed earnings picture. According to its SEC filing, Arm reported quarterly revenue of $1.44 billion for the quarter ended September 30, 2026, up 27.1% from $1.14 billion a year earlier. Net income fell to $130.0 million from $238.0 million, while diluted earnings per share were $0.12. Revenue growth points to continued expansion, but the lower profit figure provides a contrasting signal; the technical verdict below is based on price and trading indicators, not those results.Technical Verdict: HOLD
The neutral technical bias supports a wait-and-see stance: oversold RSI and Stochastic readings raise the possibility of a pause, but negative MACD, falling OBV, and a high-volume close at the 20-day low do not confirm recovery. This verdict is invalidated if price falls below the $163.13 three-month low.- Ideal Entry Range: $163.13–$166.72, using the three-month low and current 20-day support as reference levels.
- Exit Target: $187.91, the price-plus-1.5-times-ATR reference.
- Stop Loss: $145.53, the price-minus-1.5-times-ATR reference.
Summary Data ARM
| Last price | 166.72 USD |
| Change 1 day / 5 days / 1 month | -13.08% / -27.12% / -39.44% |
| Trend / MA-cross | downtrend / none |
| SMA20 / SMA50 | 223.10 / 254.39 |
| RSI (14) / Stochastic %K | 26.9 / 4.8 |
| Bollinger %B / ATR | -11% / 14.13 |
| Support / Resistance 20 days | 166.72 / 266.28 |
| Data as of | 6 November 2026 04:00 WIB |
Disclaimer: This technical analysis is generated automatically from exchange data and indicators calculated by JournalArta, for information and education only. The verdict and the entry, target and stop-loss levels are not investment advice or a solicitation to buy or sell any security. Investment decisions and their risks rest solely with the reader.
Track ARM stock price daily: live levels, support/resistance and our full ARM analysis history.