Palo Alto Networks (PANW) Stock Falls 9.59% on Thursday, Death Cross Pressure
On November 5, 2026: price 314.67 USD, trend downtrend, RSI 33.0, support 314.67, resistance 418.78. technical analysis of panw stock. Palo Alto Networks —…

Why PANW is in focus today
- One-day move of -9.59%, about 1.5× its average daily range (ATR)
- Volume at 2.2× the 20-day average
- Closed at a 20-day low (314.67)
- Trading near its 3-month low (312.12)
- Fresh death cross: SMA20 crossed below SMA50
- Downtrend extending (5-day change -17.32%)
- Not covered by JournalArta in the last 14 days
Selected automatically from 100 NASDAQ (US) stocks by a technical-signal score with daily weighted randomisation — not a recommendation.
Trend & Price Action
At $314.67, the stock sat below both the 20-day average at $368.73 and the 50-day average at $371.68. The gap between those averages is small, but the latest-session death cross matters because it confirms that shorter-term momentum has deteriorated relative to the broader trend. The price also finished at the bottom of its 20-day range, leaving little evidence in this session of buyers defending a higher level. The close at the 20-day low, accompanied by elevated volume, strengthens the bearish signal. The price was also close to the three-month low of $312.12, making that level an immediate reference point rather than a distant chart boundary. As shown in the chart, the share price has slipped beneath the moving averages and toward the lower Bollinger band. The band’s width was 28.4% and expanding, a sign that price swings are growing rather than settling.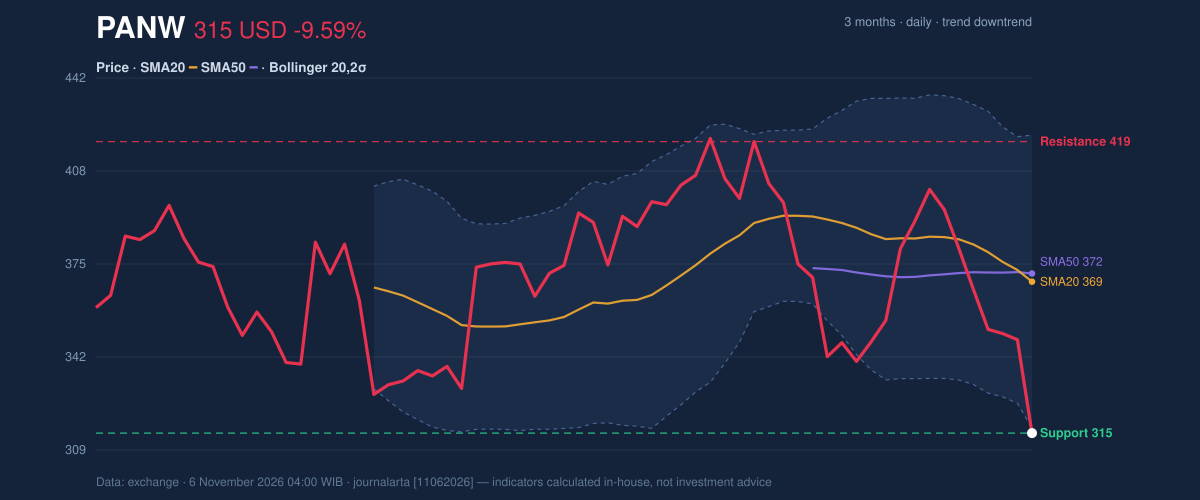
Oscillators & Momentum
Momentum readings broadly reflect the decline, though some suggest the sell-off may be stretched. The RSI was 33.0, classified as neutral, so it does not yet indicate an oversold condition under the supplied reading. By contrast, the Stochastic was oversold, with %K at 2.7 and %D at 14.2. Such a reading can occur during a sharp fall, but by itself it does not establish that a reversal has begun. The MACD remained negative at -9.162, below its -3.615 signal line, with a -5.547 histogram. That configuration indicates downside momentum is still dominant: the MACD is below its signal line, and the negative histogram shows the gap persists. The lower Bollinger reading reinforces the pressure: %B was -2%, meaning the close was below the band’s lower boundary of $316.34. This can reflect an unusually forceful move, but it is not a stand-alone timing signal.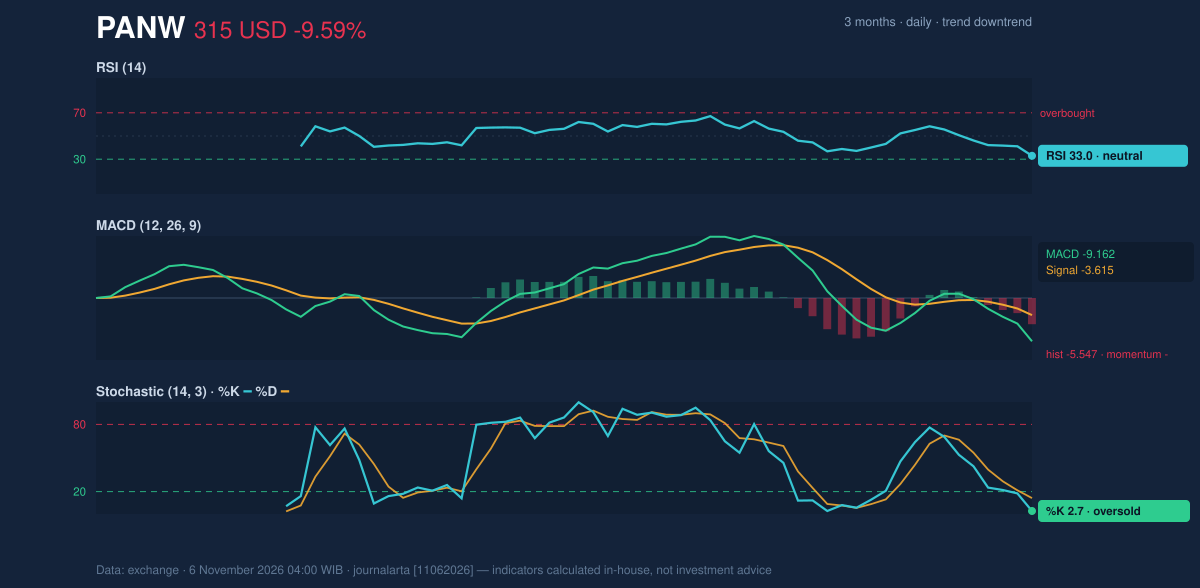
Volatility, Volume & Key Levels
Volume reached 13,320,100 shares, against a 20-day average of 6,106,520. The surge suggests heavier participation in the decline, while falling on-balance volume (OBV)—a measure that tracks buying and selling pressure through volume—adds evidence that demand has not yet recovered. Average true range, or ATR, was $20.02, equal to 6.4% of the share price, indicating high volatility and the possibility of wide daily swings. The immediate support reference is $314.67, the 20-day low; the three-month low at $312.12 is the next nearby floor in the supplied data. A break below those levels would deepen the deterioration. On the other side, the 20-day resistance is $418.78, with the three-month high at $432.33. A recovery toward resistance would still need to contend with the 20-day and 50-day averages, both near $370.Fundamental Context
The technical picture contrasts with continued revenue growth. According to its SEC filing, Palo Alto Networks reported fiscal-year revenue of $11.48 billion for the year ended July 31, 2026, up 24.5% from $9.22 billion a year earlier. But net income fell to $306.6 million from $1.13 billion, and diluted earnings per share were $0.40. Those results provide business context, but they do not change the short-term price and momentum signals described here.Technical Verdict: SELL
The bearish verdict follows the supplied technical bias: the latest-session death cross, the close at the 20-day low on volume 2.2 times its average, and declining OBV all point to sustained selling pressure. The oversold Stochastic signals that the fall may be stretched, but it does not yet outweigh those broader indicators. - Entry range: $314.67–$344.70, using the 20-day support and the supplied price-plus-1.5-ATR reference. - Exit target: $314.67, the 20-day support; if that level gives way, $312.12 is the three-month low. - Stop-loss protection: $418.78, the 20-day resistance. - Invalidation: the bearish verdict is invalidated if price breaks above $418.78. For non-traders, the chart signals that selling pressure remains dominant, although the oversold reading leaves room for a sharp bounce.Summary Data PANW
| Last price | 314.67 USD |
| Change 1 day / 5 days / 1 month | -9.59% / -17.32% / -21.04% |
| Trend / MA-cross | downtrend / death |
| SMA20 / SMA50 | 368.73 / 371.68 |
| RSI (14) / Stochastic %K | 33.0 / 2.7 |
| Bollinger %B / ATR | -2% / 20.02 |
| Support / Resistance 20 days | 314.67 / 418.78 |
| Data as of | 6 November 2026 04:00 WIB |
Disclaimer: This technical analysis is generated automatically from exchange data and indicators calculated by JournalArta, for information and education only. The verdict and the entry, target and stop-loss levels are not investment advice or a solicitation to buy or sell any security. Investment decisions and their risks rest solely with the reader.
Track PANW stock price daily: live levels, support/resistance and our full PANW analysis history.