Nvidia (NVDA) Stock on Thursday: Falls 9.26%, RSI Oversold
On November 5, 2026: price 181.60 USD, trend downtrend, RSI 25.2, support 181.60, resistance 229.28. technical analysis of nvda stock. Nvidia — full details…
Nvidia fell 9.26% to $181.60 on the Nasdaq on Thursday, November 5, 2026, as heavy trading and a fresh drop below its 20-day low reinforced a bearish technical picture. The slide was unusually sharp. Volume reached 303,158,900 shares, or 2.7 times its 20-day average, while the stock closed at the bottom of its 20-day range and near its three-month low.
Why NVDA is in focus today
- One-day move of -9.26%, about 2.3× its average daily range (ATR)
- Volume at 2.7× the 20-day average
- Closed at a 20-day low (181.60)
- Trading near its 3-month low (181.46)
- Fresh death cross: SMA20 crossed below SMA50
- RSI(14) at 25.2 — oversold zone
- Downtrend extending (5-day change -15.01%)
Selected automatically from 100 NASDAQ (US) stocks by a technical-signal score with daily weighted randomisation — not a recommendation.
Trend & Price Action
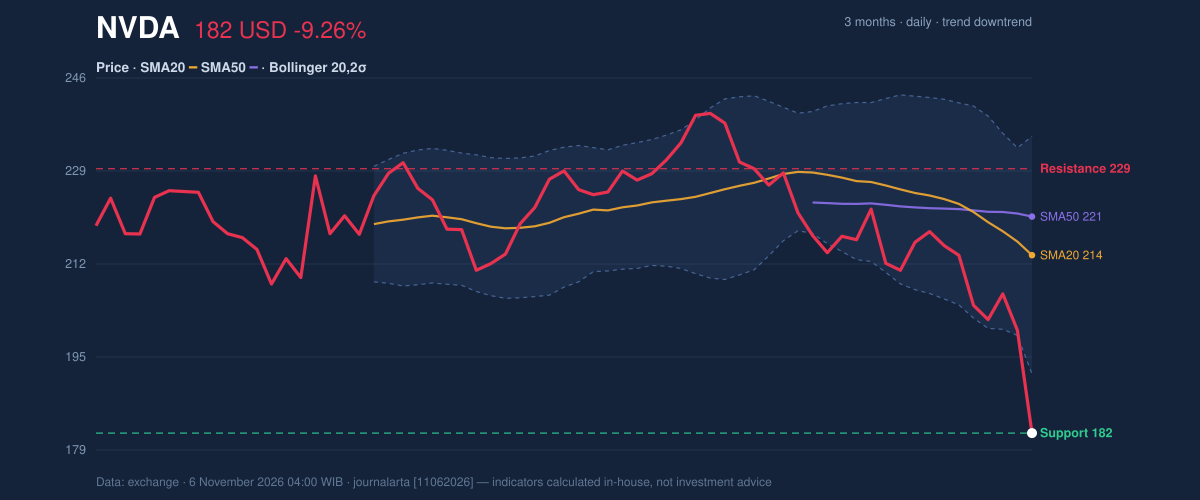
The decline extends a broader retreat: Nvidia lost 15.01% over five days and 21.21% over one month. Its price is below both the 20-day simple moving average (SMA), at $213.68, and the 50-day average, at $220.64. The 20-day average fell 4.15% over five days, indicating that the short-term trend itself is weakening, not merely that the share price has slipped below it.
A death cross formed four sessions before the latest session, when the 20-day average crossed below the 50-day average. This signal often reflects sustained deterioration in recent price action; it is not a timing guarantee, but here it aligns with the falling averages and declining price. Nvidia’s close was only just above its three-month low of $181.46.
The price also sits below the lower Bollinger Band, which is $192.25; the band’s %B reading is -25%. Bollinger Bands compare price with a moving average and its recent volatility range, so this reading marks an unusually weak position relative to that range. It can accompany forceful selling, though it does not by itself establish that a reversal is near. The bands are widening, a sign that volatility is expanding.
As shown in the chart, the price is below both moving averages and beneath the lower Bollinger Band, with the listed support and resistance levels providing reference points for the next move.
Oscillators & Momentum
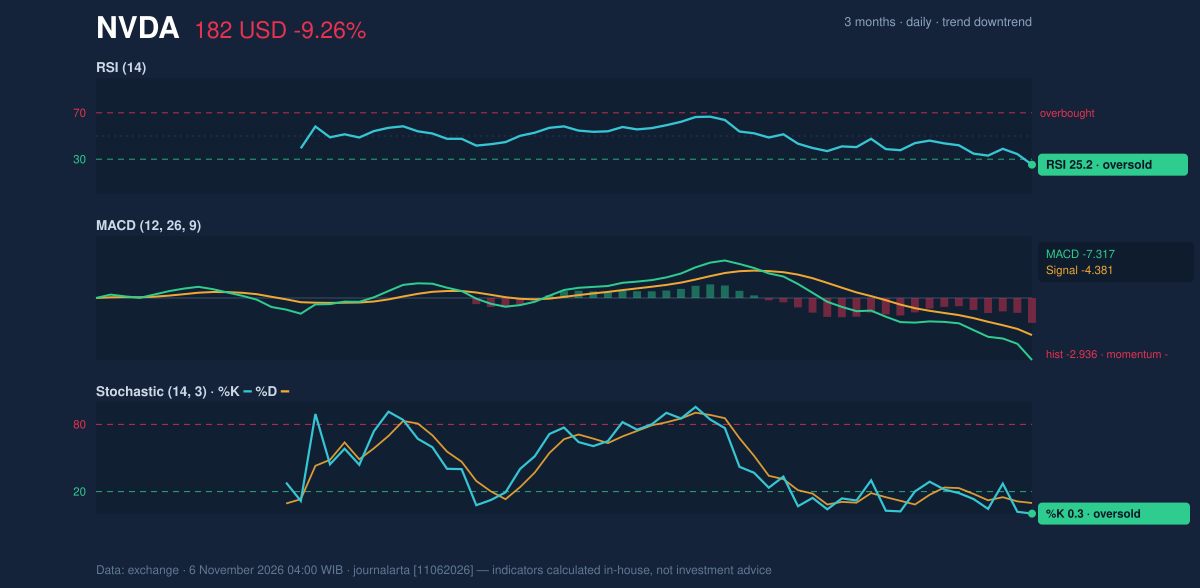
Short-term indicators show that selling has become stretched, but they have not yet confirmed a turn. The RSI is 25.2, in oversold territory; RSI measures the pace of recent gains and losses, and readings below 30 are commonly treated as oversold. The Stochastic is also deeply depressed, with %K at 0.3 and %D at 9.8. Such readings can occur during sharp declines and are not, on their own, evidence that buyers have regained control.
The MACD remains negative: MACD is -7.317, below its -4.381 signal line, with a -2.936 histogram. That configuration indicates downside momentum is still dominant. In other words, the oversold readings flag the risk of a bounce, while MACD says the prevailing push remains lower.
The momentum chart brings those signals together: RSI and Stochastic are oversold, while MACD remains negative.
Volatility, Volume & Levels
The 14-day average true range, a measure of typical price movement, is $7.46, or 4.1% of the share price. Combined with the widening Bollinger Bands, that points to elevated volatility and a greater chance of large moves in either direction. The session’s 9.26% decline was about 2.3 times the ATR, underscoring how forceful the move was.
Volume strengthens the bearish reading: the unusually high turnover coincided with a close at the 20-day low, while on-balance volume (OBV), which tracks whether trading volume is flowing with rising or falling prices, is declining. That combination suggests selling participation rather than a quiet pullback. The listed 20-day support is $181.60, effectively the latest close, and the three-month low is $181.46. A break below that area would put the data-based $170.41 reference—price minus 1.5 times ATR—in view. On a recovery, the $192.25 lower Bollinger Band is an initial reference, followed by $229.28 resistance, the 20-day range’s upper level.
Fundamental Context
The technical weakness contrasts with Nvidia’s recent reported results. According to its SEC filing, quarterly revenue was $96.22 billion for the quarter ended July 26, 2026, up 105.9% from $46.74 billion a year earlier. Net income was $59.69 billion, compared with $26.42 billion a year earlier, and diluted earnings per share were $2.46. Those figures provide a strong earnings backdrop, but they do not negate the price, volume and momentum signals in this session.
Technical Verdict: SELL
The technical verdict is SELL, matching the bearish bias in the data. The strongest reasons are the death cross formed four sessions earlier, the close at the 20-day low on volume 2.7 times average, and falling OBV alongside negative MACD momentum. The oversold RSI and Stochastic readings are a counter-signal, but neither has yet displaced the broader downtrend. The verdict is invalidated if price breaks above the $229.28 20-day resistance.
- Ideal Entry Range: $181.60–$192.79, using the 20-day support and the price-plus-1.5-ATR reference.
- Exit Target: $181.60, the 20-day support; the three-month low at $181.46 is the next lower reference.
- Stop Loss: $229.28, above the 20-day resistance.
In plain English, the chart currently shows stronger evidence of continued selling than of a confirmed recovery.
| Session | Thursday, November 5, 2026 |
|---|---|
| Latest price | $181.60 |
| Technical bias | Bearish |
| 20-day support / resistance | $181.60 / $229.28 |
| Three-month low / high | $181.46 / $243.37 |
Summary Data NVDA
| Last price | 181.60 USD |
| Change 1 day / 5 days / 1 month | -9.26% / -15.01% / -21.21% |
| Trend / MA-cross | downtrend / death |
| SMA20 / SMA50 | 213.68 / 220.64 |
| RSI (14) / Stochastic %K | 25.2 / 0.3 |
| Bollinger %B / ATR | -25% / 7.46 |
| Support / Resistance 20 days | 181.60 / 229.28 |
| Data as of | 6 November 2026 04:00 WIB |
Disclaimer: This technical analysis is generated automatically from exchange data and indicators calculated by JournalArta, for information and education only. The verdict and the entry, target and stop-loss levels are not investment advice or a solicitation to buy or sell any security. Investment decisions and their risks rest solely with the reader.
Track NVDA stock price daily: live levels, support/resistance and our full NVDA analysis history.