Coca-Cola (KO) Stock Falls 0.07% (November 5, 2026): Testing Key Resistance
On November 5, 2026: price 95.73 USD, trend uptrend, RSI 64.6, support 88.05, resistance 95.83. technical analysis of ko stock. Coca — full details here.
Why KO is in focus today
- Volume at 1.7× the 20-day average
- Trading near its 3-month high (97.39)
- Uptrend confirmed (5-day change 3.14%)
Selected automatically from 80 NYSE (US) stocks by a technical-signal score with daily weighted randomisation — not a recommendation.
Trend & Price Action
The stock closed at $95.73, just below its 20-day resistance at $95.83 and at 99% of its 20-day range. It has gained 9.07% over one month, while the 20-day moving average rose 2.44% over five days. Price remains above both the 20-day average of $92.90 and the 50-day average of $89.81, a structure consistent with an uptrend rather than a short-lived bounce. There is no new moving-average crossover. That matters: the trend is positive, but the data do not show a fresh signal that would strengthen the case for a new leg higher. The share price is also near the three-month peak of $97.39, where sellers may emerge after the recent advance. As shown in the chart, the upper Bollinger Band sits at $97.02, while the lower band is $88.77. The price is in the upper portion of the band, with %B at 84%, indicating strength but also limited room before the price meets the band’s upper boundary. The bands’ 8.9% width is normal, not a squeeze that would signal unusually compressed volatility.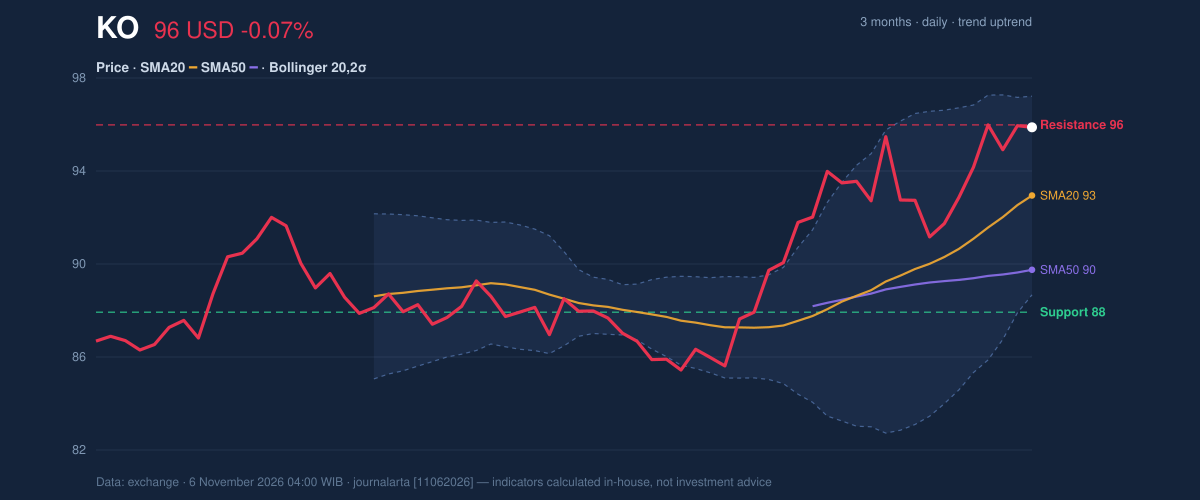
Oscillators & Momentum
Momentum indicators are positive but not uniformly accelerating. MACD is above its signal line, with a positive histogram of 0.227, a configuration that supports the current upward direction. RSI is 64.6, neutral, while Stochastic readings of 75.6 for %K and 79.1 for %D are also classified as neutral. These readings suggest buyers have had the upper hand without confirming an extreme overbought condition. There is a caution beneath that surface: the technical bias flags RSI rolling over from above 65 as its one bearish signal. That does not establish a reversal, but it points to momentum easing as the stock tests resistance. MACD remains positive, but the RSI rollover tempers the momentum signal.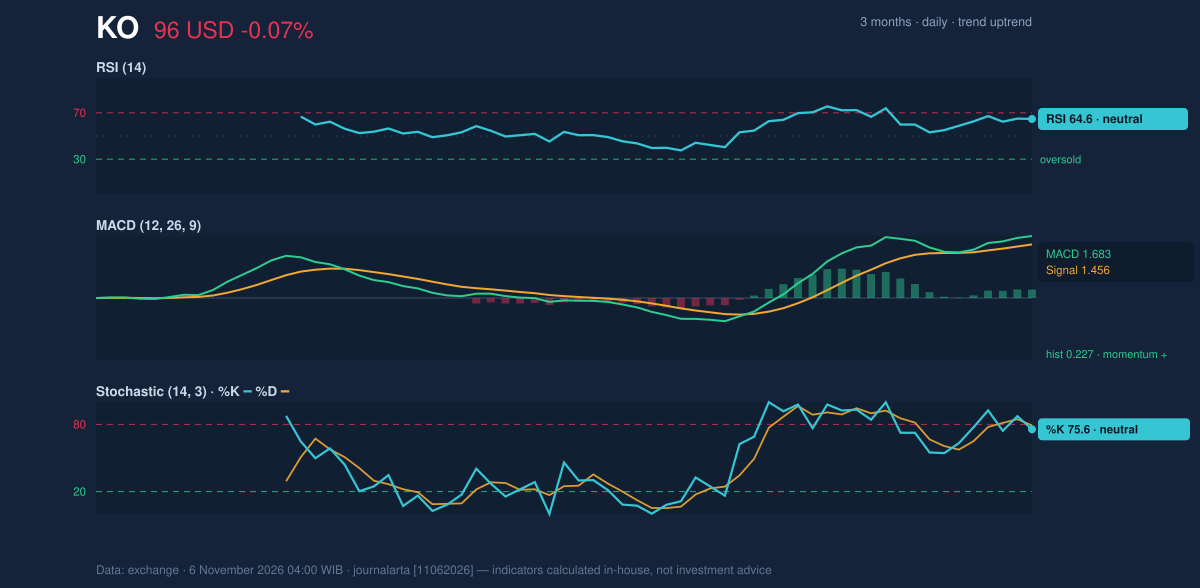
Volatility & Volume
Volume of 31,021,000 shares was 1.7 times the 20-day average of 18,201,715. A jump in trading activity can validate a move by showing broader participation. Here, however, OBV is falling. OBV tracks whether volume is generally accumulating on up days or down days; its decline conflicts with the price advance, so the volume spike alone does not prove sustained buying pressure. ATR is $1.83, or 1.9% of the share price, indicating moderate day-to-day volatility. The 1-day move was -0.07%, a pause after the stronger weekly and monthly gains. Near resistance, that combination leaves room for continued consolidation as well as a breakout attempt.Key Levels & Scenarios
The immediate test is $95.83, the 20-day resistance. A move above it would put the three-month high at $97.39 in focus; the upper Bollinger Band at $97.02 is another nearby reference. Failure to clear resistance could leave the stock rotating toward the $92.90 20-day average. Further down, $88.05 is 20-day support, with the three-month low at $85.13.Fundamental Context
The technical picture sits alongside improving reported results. According to its SEC filing, Coca-Cola recorded quarterly revenue of $13.38 billion for the quarter ended October 2, 2026, up 7.4% from $12.46 billion a year earlier. Net income was $4.01 billion, compared with $3.70 billion, and diluted earnings per share were $0.93. Those figures provide company-level context, but the technical verdict below follows the supplied price and indicator signals.Technical Verdict: HOLD (wait & see)
The neutral technical bias supports a wait-and-see stance: price is testing resistance rather than clearly breaking through it; RSI is rolling over from above 65; and falling OBV does not confirm the volume surge. The verdict is HOLD while KO tests resistance and momentum signals remain mixed. It would be invalidated on the downside if price falls below $88.05, the 20-day support. - Entry range: $92.90–$95.83, using the 20-day average and resistance as reference levels. - Exit target: $97.39, the three-month high. - Stop-loss protection: $88.05, the 20-day support. In plain English, the indicators do not yet show a clear direction: the trend is up, but resistance and mixed participation argue for caution.Summary Data KO
| Last price | 95.73 USD |
| Change 1 day / 5 days / 1 month | -0.07% / 3.14% / 9.07% |
| Trend / MA-cross | uptrend / none |
| SMA20 / SMA50 | 92.90 / 89.81 |
| RSI (14) / Stochastic %K | 64.6 / 75.6 |
| Bollinger %B / ATR | 84% / 1.83 |
| Support / Resistance 20 days | 88.05 / 95.83 |
| Data as of | 6 November 2026 04:00 WIB |
Disclaimer: This technical analysis is generated automatically from exchange data and indicators calculated by JournalArta, for information and education only. The verdict and the entry, target and stop-loss levels are not investment advice or a solicitation to buy or sell any security. Investment decisions and their risks rest solely with the reader.
Track KO stock price daily: live levels, support/resistance and our full KO analysis history.