Taiwan Semiconductor (TSM) Stock Technicals: Falls 10.78% on Thursday, RSI Oversold
On November 5, 2026: price 353.10 USD, trend downtrend, RSI 26.3, support 353.10, resistance 453.31. technical analysis of tsm stock. Taiwan Semiconductor —…

Why TSM is in focus today
- One-day move of -10.78%, about 2.3× its average daily range (ATR)
- Volume at 3.1× the 20-day average
- Closed at a 20-day low (353.10)
- Trading near its 3-month low (351.19)
- Fresh death cross: SMA20 crossed below SMA50
- RSI(14) at 26.3 — oversold zone
- Downtrend extending (5-day change -18.23%)
Selected automatically from 80 NYSE (US) stocks by a technical-signal score with daily weighted randomisation — not a recommendation.
Trend & Price Action
The session’s decline extended TSMC’s losses to 18.23% over five days and 22.90% over one month. The share price finished below its 20-day moving average of 420.33 and its 50-day average of 432.68, a sign that recent weakness has become entrenched rather than limited to a single volatile session. A death cross—when the shorter-term average falls below the longer-term one—formed three sessions before the latest session. The 20-day average’s slope was also negative, falling 4.68% over five days. Together, those signals indicate that both recent price direction and the average trend are pointing lower. TSMC ended at the stated 20-day support of $353.10, just above its three-month low of $351.19. That leaves little room between the closing price and the recent low: a break below this area would put the stock at a lower point in its three-month range, while a hold would offer an initial sign that selling pressure is meeting support. The price is also below the lower Bollinger Band, at a %B reading of -27%. Bollinger Bands compare price with a rolling average and measure how far it has moved from that average; a reading below the lower band shows an unusually weak position, not proof that a rebound is due. The bands are widening, consistent with elevated volatility.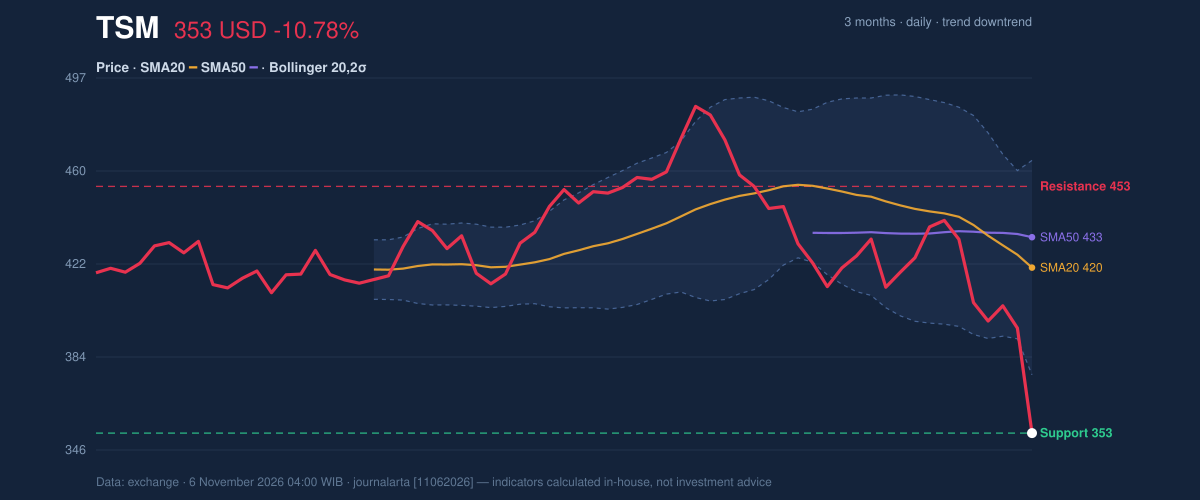
Oscillators & Momentum
The RSI, a measure of the pace of recent gains and losses, stood at 26.3, in oversold territory. The Stochastic reading was similarly stretched, with %K at 2.1 and %D at 8.6. Such readings can reflect intense selling and make a short-term bounce possible, but they do not establish that the downtrend has reversed. The MACD remained negative at -14.033, below its signal line at -7.672, with a histogram of -6.361. In plain terms, the indicator still shows downward momentum rather than an improving trend. The oversold readings and negative MACD therefore tell different parts of the same story: the fall has been severe, but the available momentum signal has not turned upward.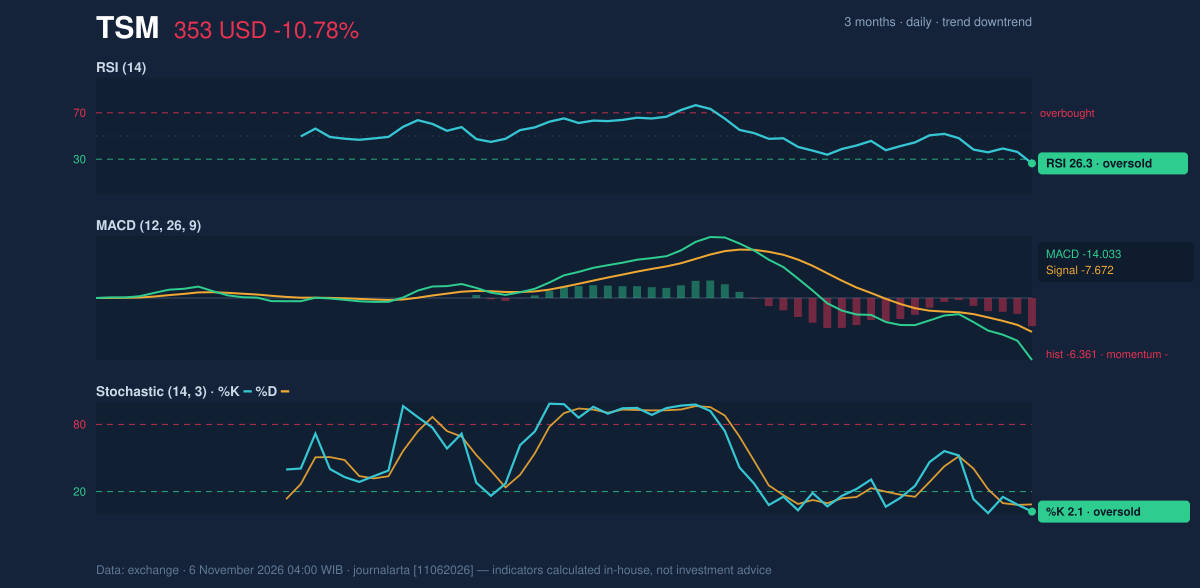
Volatility, Volume & Key Levels
Volume reached 42,742,100 shares, or 3.1 times the 20-day average, while on-balance volume (OBV), which tracks whether trading is accumulating or distributing shares, was falling. Heavy turnover alongside declining OBV suggests broad participation in the selloff, rather than a low-volume retreat. The session’s average true range was $16.56, equal to 4.7% of the share price, underscoring the potential for large daily moves. The next nearby reference is the three-month low at $351.19; the 20-day support is the closing level at $353.10. A sustained move below the three-month low would deepen the breakdown. On a recovery, the data place the first substantial resistance at $453.31, with the 20-day and 50-day averages at 420.33 and 432.68 between that level and the current price.Technical Verdict: SELL
The bearish verdict matches the supplied technical bias. Three signals support it: the death cross formed three sessions ago; the close was at the 20-day low on volume 3.1 times average; and OBV was falling. The RSI and Stochastic are oversold, a potential short-term rebound risk, but neither has confirmed a reversal while MACD remains negative. The verdict is invalidated if the price breaks above the 20-day resistance at $453.31; that would challenge the current downside structure. These levels are technical reference points, not a forecast.- Ideal entry range: $420.33–$453.31, using the 20-day average and 20-day resistance as reference levels.
- Exit target: $353.10 at 20-day support, with $351.19 as the three-month low reference.
- Stop-loss protection: $453.31, the 20-day resistance, as the level above which the bearish setup is invalidated.
| Metric | Reading |
|---|---|
| Last price | $353.10 |
| Daily change | -10.78% |
| Five-day change | -18.23% |
| One-month change | -22.90% |
| 20-day / 50-day average | 420.33 / 432.68 |
| RSI / Stochastic | 26.3 / %K 2.1, %D 8.6 |
| MACD / signal / histogram | -14.033 / -7.672 / -6.361 |
| Volume / 20-day average | 42,742,100 / 13,977,800 |
| 20-day support / resistance | 353.10 / 453.31 |
| Three-month low / high | 351.19 / 487.47 |
Summary Data TSM
| Last price | 353.10 USD |
| Change 1 day / 5 days / 1 month | -10.78% / -18.23% / -22.90% |
| Trend / MA-cross | downtrend / death |
| SMA20 / SMA50 | 420.33 / 432.68 |
| RSI (14) / Stochastic %K | 26.3 / 2.1 |
| Bollinger %B / ATR | -27% / 16.56 |
| Support / Resistance 20 days | 353.10 / 453.31 |
| Data as of | 6 November 2026 04:00 WIB |
Disclaimer: This technical analysis is generated automatically from exchange data and indicators calculated by JournalArta, for information and education only. The verdict and the entry, target and stop-loss levels are not investment advice or a solicitation to buy or sell any security. Investment decisions and their risks rest solely with the reader.
Track TSM stock price daily: live levels, support/resistance and our full TSM analysis history.