Advanced Micro Devices (AMD) Stock Falls 17.26% (November 5, 2026): RSI Oversold
On November 5, 2026: price 404.40 USD, trend downtrend, RSI 29.7, support 404.40, resistance 608.10. technical analysis of amd stock. Advanced Micro Devices —…

Why AMD is in focus today
- One-day move of -17.26%, about 1.9× its average daily range (ATR)
- Volume at 2.7× the 20-day average
- Trading near its 3-month low (402.10)
- Fresh death cross: SMA20 crossed below SMA50
- RSI(14) at 29.7 — oversold zone
- Downtrend extending (5-day change -28.60%)
- Not covered by JournalArta in the last 14 days
Selected automatically from 100 NASDAQ (US) stocks by a technical-signal score with daily weighted randomisation — not a recommendation.
Trend & Price Action
AMD closed at $404.40, down 28.60% over five sessions and 34.85% over one month. The close sits below both the 20-day moving average of $535.25 and the 50-day average of $547.37, a sign that recent weakness extends beyond a single session. The 20-day average itself fell 7.22% over five days, showing that the short-term trend is deteriorating rapidly. A death cross—when a shorter-term average falls below a longer-term one—formed one session before the latest session, as the 20-day average crossed below the 50-day average. That is a bearish trend signal, not proof that losses must continue. But the close also fell below the stated 20-day support, on unusually heavy volume, while the On-Balance Volume (OBV), a measure that tracks whether trading activity is accumulating on up or down days, declined. Together, those signals point to selling pressure with broad participation. The stock finished at the bottom of its stated 20-day trading range, with support at $404.40 and resistance at $608.10. It is also close to its three-month low of $402.10. As shown in the chart, the price’s position below the moving averages and lower Bollinger Band illustrates how far the latest decline has stretched from recent norms.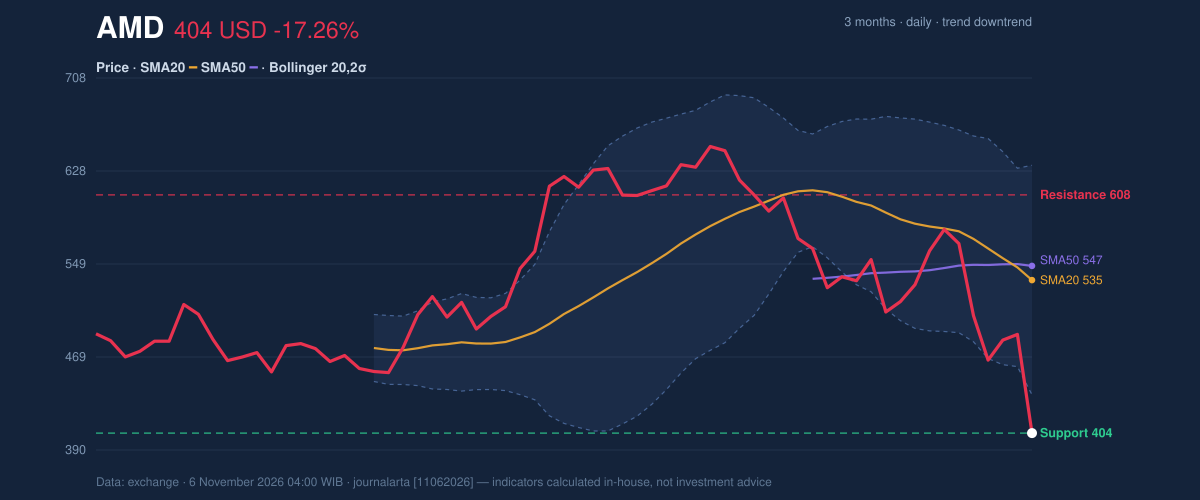
Oscillators & Momentum
The Relative Strength Index (RSI), which measures the speed and scale of recent price changes, stood at 29.7, in oversold territory. The Stochastic indicator was also oversold: %K at 1.3 and %D at 12.4. These readings say that selling has been intense; they do not, by themselves, confirm that a rebound has begun. The Moving Average Convergence Divergence (MACD), a trend-momentum measure, remained negative at -27.766, below its signal line at -14.123, with a negative histogram of -13.644. That alignment indicates downside momentum is still dominant. Oversold oscillators therefore offer a possible sign of exhaustion, but they conflict with the broader trend rather than overturn it.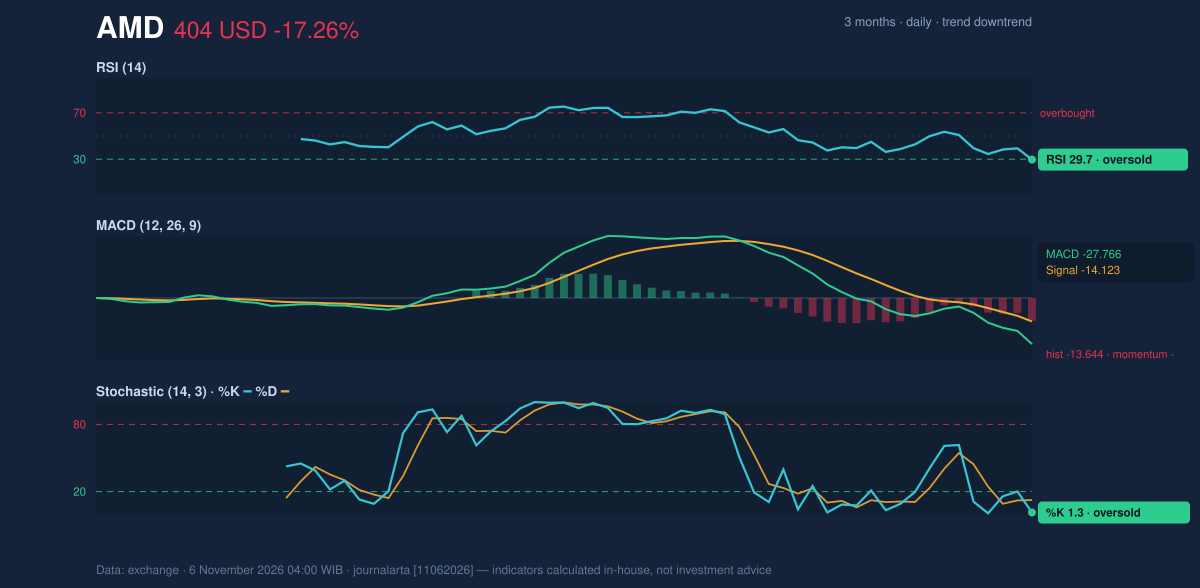
Volatility & Volume
AMD’s close was below the Bollinger Band’s lower boundary of $437.10, leaving its %B reading at -17%. Bollinger Bands widen as volatility rises; here, the bands had expanded to 36.7%, indicating unusually unsettled trading rather than a contained pullback. The Average True Range, which estimates typical daily price movement, was $35.90, or 8.9% of the share price. The 70,453,900 shares traded—2.7 times the 20-day average of 25,949,850—make the decline harder to dismiss as a low-participation dip. Heavy volume alongside falling OBV reinforces the bearish reading, even as the oversold RSI and Stochastic leave room for a sharp counter-move.Fundamental Context
The technical weakness contrasts with AMD’s reported business growth. According to its SEC filing, revenue for the quarter ended September 26, 2026, rose 44.7% to $13.38 billion from $9.25 billion a year earlier. Net income increased to $2.43 billion from $1.24 billion, and diluted earnings per share were $1.46. AMD filed a Form 8-K with the U.S. Securities and Exchange Commission on November 3 reporting results of operations and financial condition and a Regulation FD disclosure. Strong reported results provide context, but they do not erase the current price and volume signals.Technical Verdict: SELL
The technical bias is bearish. Three indicators drive that assessment: the death cross formed one session before the latest session; price closed below the 20-day low on volume well above average; and OBV is falling. The oversold RSI and Stochastic point to the risk of a rebound, but neither has yet reversed the negative MACD or the downtrend.- Ideal entry range: $404.40–$458.25, bounded by the stated 20-day support and the price-plus-1.5-ATR reference level.
- Exit target: $402.10, the three-month low and next downside reference below the 20-day support.
- Stop-loss protection: $608.10, the 20-day resistance level.
Summary Data AMD
| Last price | 404.40 USD |
| Change 1 day / 5 days / 1 month | -17.26% / -28.60% / -34.85% |
| Trend / MA-cross | downtrend / death |
| SMA20 / SMA50 | 535.25 / 547.37 |
| RSI (14) / Stochastic %K | 29.7 / 1.3 |
| Bollinger %B / ATR | -17% / 35.90 |
| Support / Resistance 20 days | 404.40 / 608.10 |
| Data as of | 6 November 2026 04:00 WIB |
Disclaimer: This technical analysis is generated automatically from exchange data and indicators calculated by JournalArta, for information and education only. The verdict and the entry, target and stop-loss levels are not investment advice or a solicitation to buy or sell any security. Investment decisions and their risks rest solely with the reader.
Track AMD stock price daily: live levels, support/resistance and our full AMD analysis history.