Airbnb (ABNB) Stock Falls 3.54% on Thursday, Golden Cross Formed
On November 5, 2026: price 170.13 USD, trend sideways, RSI 51.7, support 163.50, resistance 176.94. technical analysis of abnb stock. Airbnb — full details…
Why ABNB is in focus today
- Volume at 2.4× the 20-day average
- Fresh golden cross: SMA20 crossed above SMA50
Selected automatically from 100 NASDAQ (US) stocks by a technical-signal score with daily weighted randomisation — not a recommendation.
Trend & Price Action
Airbnb remains in a sideways trend, but its short-term averages have tilted upward. The 20-day simple moving average (SMA) rose 1.13% over five days, and the 20-day average crossed above the 50-day average one session before the latest session. Known as a golden cross, this pattern can signal improving trend structure, though it does not guarantee that prices will continue rising. The close was just below the 20-day SMA at $170.26, while remaining above the 50-day SMA at $168.96. That leaves a mixed picture: the shorter-term average is rising and has moved above the longer-term one, but the share price has slipped below the shorter-term benchmark. The close sat at 49% of the 20-session range, between support at $163.50 and resistance at $176.94. The chart puts that tug-of-war in context.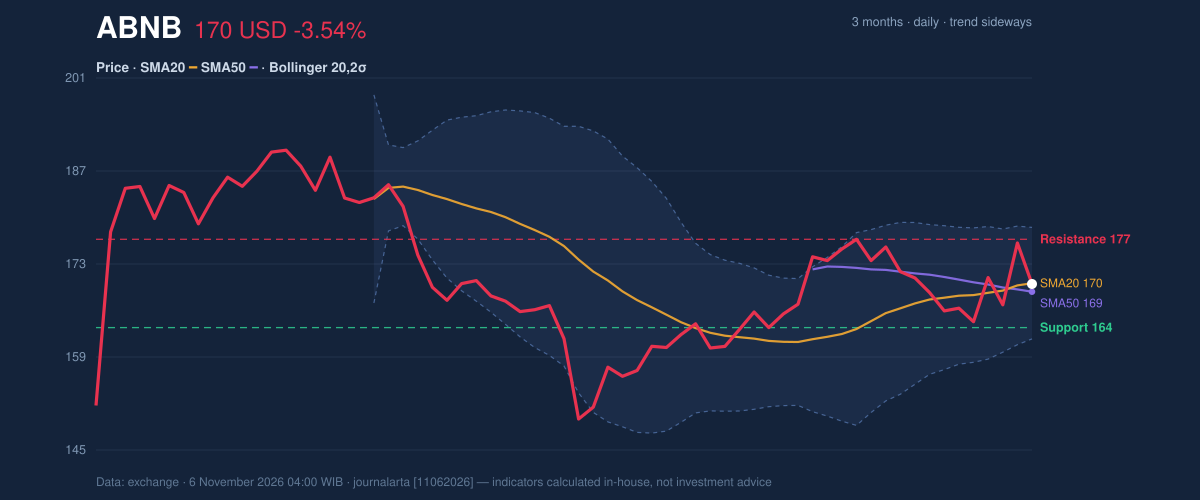
Oscillators & Momentum
Momentum indicators are constructive but not forceful. The MACD histogram was positive at 0.052, with MACD at 0.873 above its 0.821 signal line. MACD compares moving averages to gauge momentum; a positive histogram indicates the faster measure is ahead, supporting the bullish reading, but the small gap suggests the signal is modest. The RSI was neutral at 51.7, while the Stochastic readings were also neutral, with %K at 37.8 below %D at 44.6. RSI measures the pace of recent gains and losses; Stochastic compares a closing price with its recent range. Neither currently points to an extreme condition, and the Stochastic relationship tempers the positive MACD signal. The momentum panel shows why the indicators do not yet align decisively.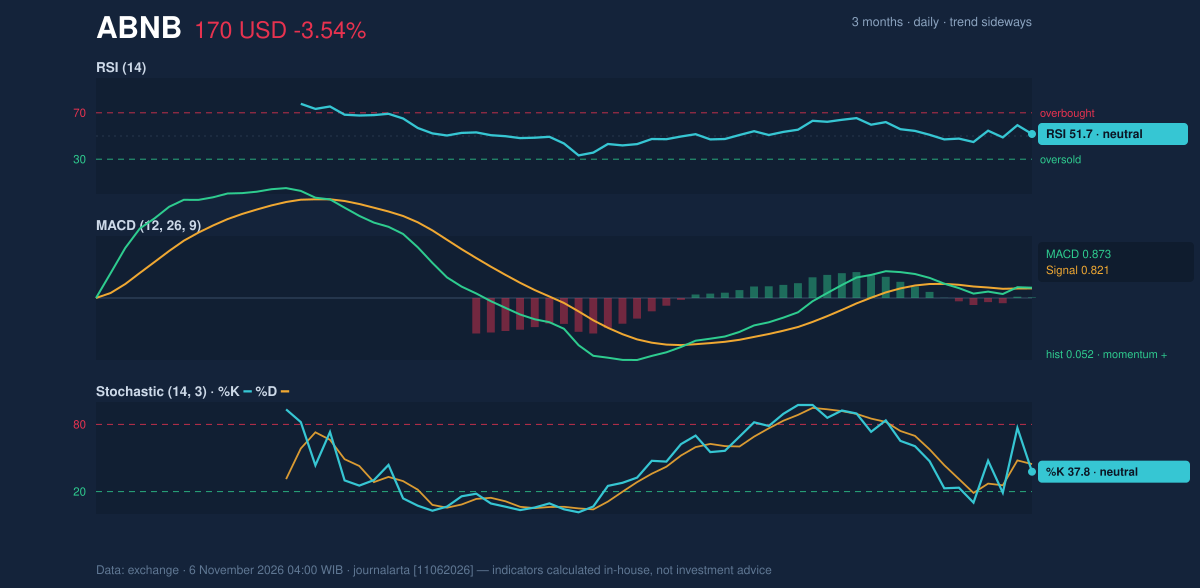
Volatility, Volume & Levels
Airbnb’s Bollinger Bands—the upper and lower boundaries around a moving average—were at $178.75 and $161.77, with the middle band at $170.26. The %B reading of 49% places the price near the band’s midpoint, while the 10.0% band width was normal, not unusually compressed or expanded. That offers little evidence of an imminent volatility breakout. Average true range, a measure of typical price movement, was $5.30, or 3.1% of the share price, indicating moderate volatility. The recent session’s volume spike deserves attention, but falling OBV means the activity did not confirm a clear buildup in buying pressure. The key near-term test is whether the shares can regain the 20-day average and approach resistance at $176.94. A move through that level would bring the three-month high of $193.45 into view as the next major reference. On the downside, support at $163.50 is the immediate level to watch; below it, the data’s price-minus-1.5-ATR reference is $162.18. The three-month low is $148.75.Fundamental Context
The technical setup comes against a strong reported quarter. Airbnb recorded revenue of $4.87 billion for the quarter ended September 30, 2026, up 18.9% from $4.10 billion a year earlier, and net income of $1.89 billion versus $1.37 billion, according to its SEC filing. The company filed a Form 10-Q and reported its results to the U.S. Securities and Exchange Commission in a Form 8-K on November 5. Those results provide business context, but the verdict below is based on the trading indicators.Technical Verdict: BUY
The bullish classification rests on three signals: the golden cross formed one session before the latest session; the MACD histogram turned positive; and the price remains above the 50-day average after a pullback toward the 20-day average. The counterweight is the close below the 20-day average, alongside declining OBV after the volume surge. The verdict is invalidated if the price falls below $163.50, the 20-day support level.- Ideal entry range: $168.96–$170.26, bounded by the 50-day and 20-day averages.
- Exit target: $176.94, the next 20-day resistance.
- Stop-loss protection: $162.18, the price-minus-1.5-ATR reference below 20-day support.
Summary Data ABNB
| Last price | 170.13 USD |
| Change 1 day / 5 days / 1 month | -3.54% / 2.21% / 4.23% |
| Trend / MA-cross | sideways / golden |
| SMA20 / SMA50 | 170.26 / 168.96 |
| RSI (14) / Stochastic %K | 51.7 / 37.8 |
| Bollinger %B / ATR | 49% / 5.30 |
| Support / Resistance 20 days | 163.50 / 176.94 |
| Data as of | 6 November 2026 04:00 WIB |
Disclaimer: This technical analysis is generated automatically from exchange data and indicators calculated by JournalArta, for information and education only. The verdict and the entry, target and stop-loss levels are not investment advice or a solicitation to buy or sell any security. Investment decisions and their risks rest solely with the reader.
Track ABNB stock price daily: live levels, support/resistance and our full ABNB analysis history.