QCOM Stock Week Ahead: Levels and Scenarios for November 9–13
QCOM stock week ahead for November 9–13: last close 165.41 USD, weekly change 0.38%, support 156.75, resistance 185.41.
By matthew jonathan
November 7, 20265 min read
Advertisement
Logo Qualcomm — JournalArta illustration
Last Week in Review
Qualcomm gained 0.38% in the November 2–6 trading week, ending Friday at $165.41 after a sharp reversal between sessions. The stock reached a weekly high of $174.00 on November 4, then plunged to $148.25 on November 5 before rebounding. Friday was the strongest session, up 5.52%; Thursday was the weakest, down 9.49%. QCOM rose in three sessions and fell in two.
The weekly range was 17.37%, with the close at 67% of that range. Average daily volume was 20,925,340 shares, or 1.98 times the preceding 20-session average of 10,541,910. The weekly gain was modest; the trading was not.
Technical Map for the Week Ahead
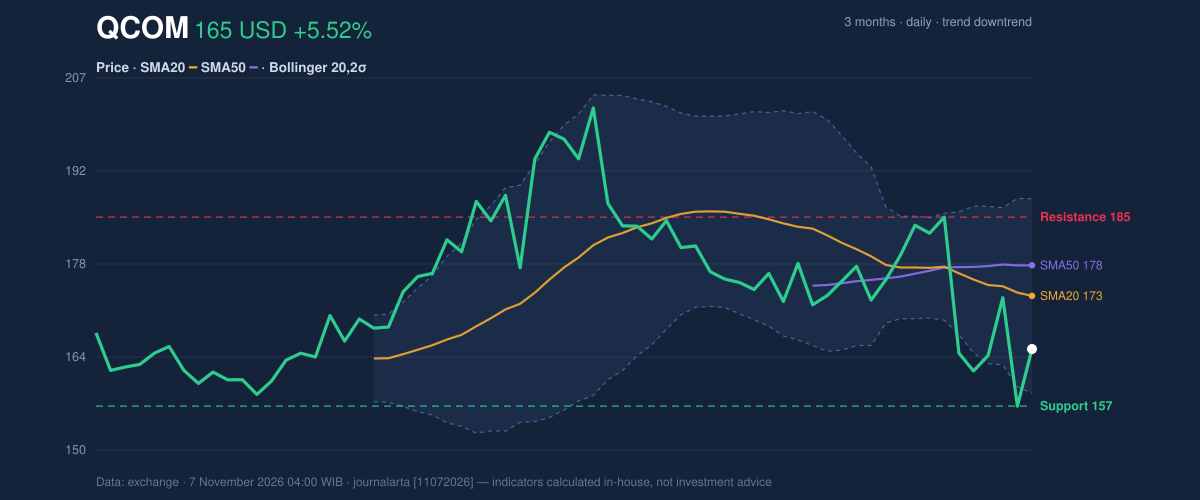
QCOM enters November 9–13 below its 20-day moving average of $173.46 and its 50-day average of $178.11, with no new moving-average crossover. The 20-day average is falling at 1.94% per five days, consistent with the stated downtrend. The nearest 20-day support is $156.75 and resistance is $185.41. Over three months, the range is $148.25–$205.85.
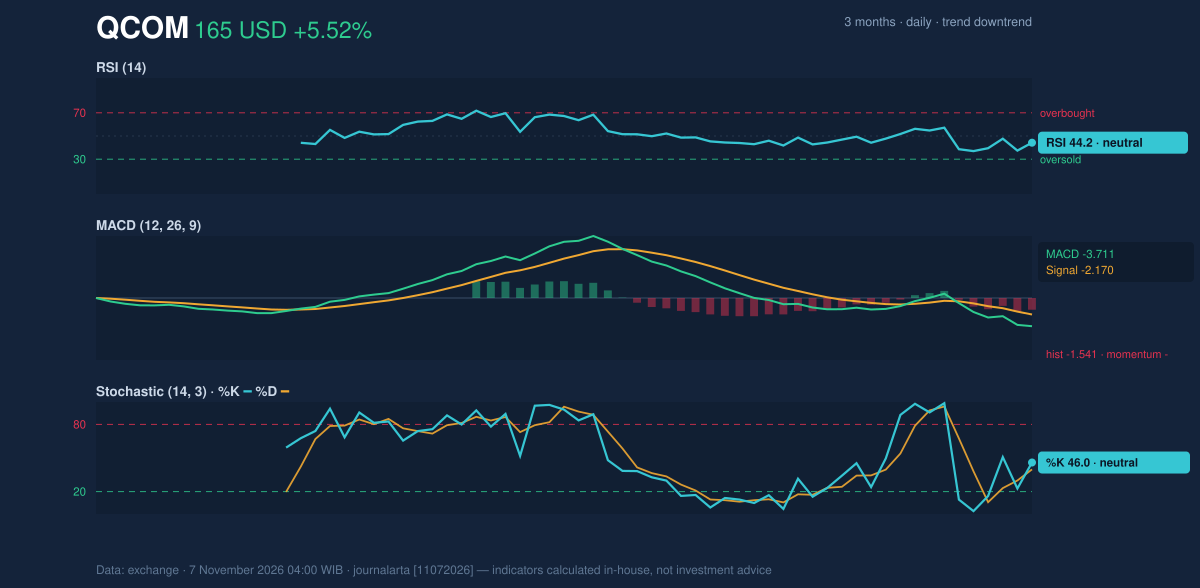
Momentum readings are mixed but not decisively positive. The 14-day RSI is 44.2, a neutral reading, while the stochastic is also neutral at 46.0 for %K and 39.8 for %D. MACD is negative at -3.711, below its -2.170 signal line, with a -1.541 histogram. That combination points to negative momentum, even as Friday’s rebound lifted the close.
The Bollinger range, which measures price relative to a moving band around its average, runs from $158.71 to $188.20, with a midpoint of $173.46. QCOM’s %B reading of 23% places it in the lower portion of that band; its 17.0% width is classified as normal. ATR, a measure of typical price movement, is $9.10, or 5.5% of the share price, indicating high volatility. Volume on the latest session was 1.5 times its 20-day average, while OBV—an indicator tracking whether volume tends to accompany rising or falling prices—was down.
3-month price action chart of QCOM: price, SMA20/50, Bollinger, support & resistance.
Advertisement
The price chart puts the recovery against the week’s steep drop and the longer-term resistance overhead.
Momentum chart of QCOM: RSI(14), MACD, Stochastic.
The momentum chart shows neutral RSI alongside a negative MACD reading.
BULLISH SCENARIO: A move above the $173.46 20-day average would be an initial test of whether the rebound can reclaim short-term trend support; the next notable reference is $178.11, the 50-day average. BEARISH SCENARIO: A break below $156.75 would put the November 5 low of $148.25 in focus.
Fundamentals and Catalysts
Qualcomm reported fiscal-year revenue of $43.12 billion, down 2.6% from $44.28 billion a year earlier, for the year ended September 27, 2026, according to its Form 10-K filed November 4. The same filing reported net income of $13.63 billion, compared with $5.54 billion a year earlier, and diluted earnings per share of $12.70. Qualcomm also filed a Form 8-K with the U.S. Securities and Exchange Commission reporting results of operations and financial condition on November 4.
The earnings picture is therefore mixed: annual revenue declined, while reported net income rose. That distinction matters when investors assess whether stronger profitability can offset softer sales.
Qualcomm’s call summary, reported November 4, said memory pricing pressures and data center mix weigh on its handset and gross-margin outlook. It also said guidance includes a $5 billion FY27 data center target. Those comments put the outlook for handsets and margins alongside the company’s stated data-center ambition as relevant operating context.
Advertisement
Macro, Political and Global Factors
The research provided contains no verified dated macroeconomic, political or broader global facts relevant to this week’s analysis. No additional claims are introduced.
Risks and What Would Invalidate the Scenario
The neutral technical bias leaves the stock vulnerable to movement in either direction. A close or sustained move under $156.75 would break the 20-day support reference; below that, the three-month low is $148.25. On the upside, reclaiming $173.46 would challenge the falling 20-day average, but the $178.11 50-day average and $185.41 20-day resistance remain higher barriers.
The readings also leave room for sharp swings: ATR is $9.10, and last week’s range reached 17.37%. Downward OBV and negative MACD are risks to the rebound, while the neutral RSI and stochastic do not confirm strong directional momentum. Fundamentally, the reported decline in annual revenue and the cited pressures on handset and gross-margin outlook are relevant uncertainties; the data supplied do not establish how those factors will affect the stock during the week.
Advertisement
Technical Verdict for the Week: HOLD
HOLD (wait & see) matches the neutral technical bias. The strongest reasons are the neutral RSI at 44.2, neutral stochastic readings, and the negative MACD histogram at -1.541; the price also remains below both the falling 20-day average and the 50-day average. Downward OBV adds a caution against treating Friday’s rebound as a confirmed trend change.
- Entry Range: $156.75–$173.46, using 20-day support and the 20-day moving average as reference levels.
- Target Price: $185.41, the 20-day resistance reference.
- Stop Loss: $151.77, the supplied price-minus-1.5×ATR level.
- Invalidation: The neutral technical view is invalidated if price breaks below $156.75, the 20-day support.
In plain English, the signals are mixed, so the chart does not yet show a clear direction.
QCOM Week Ahead Data
Trading week
November 2 – November 6 (5 sessions)
Weekly change
0.38% (164.79 → 165.41 USD)
Week high / low
174.00 (November 4) / 148.25 (November 5)
Best / worst session
5.52% (November 6) / -9.49% (November 5)
Avg daily volume vs prior 20 sessions
20,925,340 vs 10,541,910 (1.98x)
SMA20 / SMA50
173.46 / 178.11
RSI (14) / Stochastic %K
44.2 / 46.0
Support / Resistance 20 days
156.75 / 185.41
3-month high / low
205.85 / 148.25
Week covered
November 9–13, 2026
Data as of
7 November 2026 04:00 WIB
Advertisement
Disclaimer: This technical analysis is generated automatically from exchange data and indicators calculated by JournalArta, for information and education only. The verdict and the entry, target and stop-loss levels are not investment advice or a solicitation to buy or sell any security. Investment decisions and their risks rest solely with the reader.